13. Review of Geospatial Vector Data#
In this lecture, we will review geospatial vector data structures.
Attribution The content of this lecture are modified from three excellent sources: Introduction to Spatial Vector Data File Formats in Open Source Python from Earth Lab CU Boulder; Introduction to Vector Data from Software Carpentry; and Overview of GeoJSON from Cloud Native Data Workshop.
13.1. Geospatial Vector Data#
Vector data structures represent specific features on the Earth’s surface, and assign attributes to those features. Vectors are composed of discrete geometric locations (x, y values) known as vertices that define the shape of the spatial object. The organization of the vertices determines the type of vector that we are working with: point, line or polygon.
Point: Each point is defined by a single x, y coordinate and has a dimension of 0. Examples of point data include: sampling locations, the location of individual trees, or the location of survey plots.
LineString: LineString is composed of many (at least 2) points that are connected and has a dimension of 1. For instance, a road or a stream may be represented by a line. This line is composed of a series of segments, each “bend” in the road or stream represents a vertex that has a defined x, y location.
Polygon: A polygon consists of 3 or more vertices that are connected and closed and has a dimension of 2. The outlines of survey plot boundaries, lakes, oceans, and states or countries are often represented by polygons.
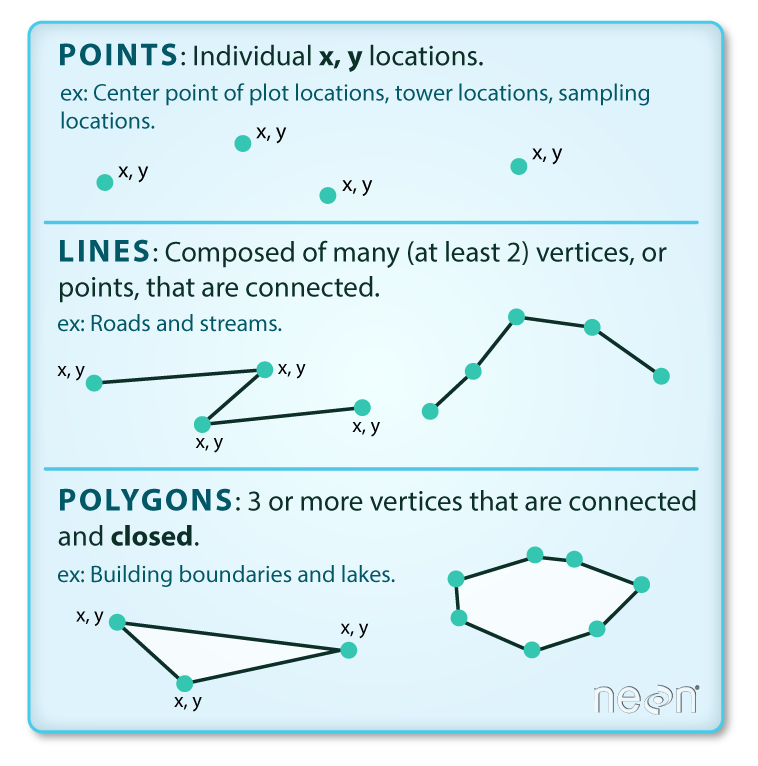
Fig. 13.1 Types of vector objects (Source: National Ecological Observatory Network (NEON))#
If we have more than one vector data shape, you can create a multiple type. There three of these data:
MultiPoint: A
MultiPointgeometry is represented by multiple coordinate point pairsMultiLineString:
MultiPolygon:
13.2. GeoJSON Schemas#
In this class, we will mostly use GeoJSONs for vector data formats (refer to the lecture on The Landscape of Geospatial Data and Tools for more information about different formats.) You can represent any vector data type in GeoJSON format as described in the schemas in the following. Based on the latest GeoJSON specification, all coordinates should be recorded using a geographic coordinate reference system, using the World Geodetic System 1984 (WGS 84) [WGS84] datum, with longitude and latitude units of decimal degrees.
GeoJSON Point Schema
{
  "type": "Point",
  "coordinates": [-112.4471, 34.5510]
}
GeoJSON LineString Schema
{
  "type": "LineString",
  "coordinates": [
      [-112.4470, 34.5510], [-112.4695,  34.541]
    ]
}
GeoJSON Polygon Schema
{
  "type": "Polygon",
  "coordinates": [
      [[-112.485, 34.529], [-112.445, 34.529], [-112.445, 34.559], [-112.485, 34.559], [-112.485, 34.529]]
    ]
}
GeoJSON MultiPoint Schema
{
  "type": "MultiPoint",
  "coordinates": [
      [-112.4470, 34.5510],
      [-112.4695,  34.541]
    ]
}
GeoJSON MultiLineString Schema
{
  "type": "MultiLineString",
  "coordinates": [
      [[-112.44708, 34.5510], [-112.46953, 34.540924]],
      [[-112.4471, 34.5510], [-112.4541,34.54447], [-112.46953, 34.540924]]
    ]
}
GeoJSON MultiPolygon Schema
{
  "type": "MultiPolygon",
  "coordinates": [
    [
      [[-112.0, 35.0], [-112.0, 34.0],  [-113.0, 34.0],  [-113.0, 35.0],  [-112.0, 35.0]]
    ],
    [
      [[-112.50, 35.50], [-112.50, 34.50], [-113.50, 34.50],  [-113.50, 35.50], [-112.50, 35.50]]
    ],
    [
      [[-111.50, 34.50], [-111.50, 33.50], [-112.50, 33.50],  [-112.50, 34.50], [-111.50, 34.50]]
    ]
  ]
}
GeoJSON GeometryCollection
{
  "type": "GeometryCollection",
  "geometries": [{
      "type": "Point",
      "coordinates": [-112.4471, 34.5510]
  }, {
      "type": "LineString",
      "coordinates": [
          [-112.4470, 34.5510], [-112.4695,  34.541]
        ]
  }]
}
GeoJSON Feature
{
  "type": "Feature",
  "geometry": {
    "type": "Point",
    "coordinates": [-112.4470, 34.5510]
  },
  "properties": {
    "name": "AGIC Venue"
  }
}
GeoJSON FeatureCollection Point
{
  "type": "FeatureCollection",
  "features": [
    {
      "type": "Feature",
      "properties": {
        "Location Name" : "Prescott Resort and Conference Center"
      },
      "geometry": {
        "type": "Point",
        "coordinates": [
          -112.44677424430846,
          34.55109119815299
        ]
      }
    }
  ]
}
GeoJSON FeatureCollection with multiple attributes
{
  "type": "FeatureCollection",
  "features": [
    {
      "type": "Feature",
      "properties": {},
      "geometry": {
        "type": "LineString",
        "coordinates": [
          [
            -112.44717121124268,
            34.551069106918945
          ],
          [
            -112.45414495468138,
            34.54447682068866
          ],
          [
            -112.46953010559082,
            34.540924192549795
          ]
        ]
      }
    },
    {
      "type": "Feature",
      "properties": {},
      "geometry": {
        "type": "Point",
        "coordinates": [
          -112.44691371917723,
          34.551210490715455
        ]
      }
    }
  ]
}
13.3. Properties#
Vector data has some important advantages:
The geometry itself contains information about what the dataset creator thought was important
The geometry structures hold information in themselves - why choose point over polygon, for instance?
Each geometry feature can carry multiple attributes instead of just one, e.g. a database of cities can have attributes for name, country, population, etc
Data storage can be very efficient compared to rasters
The downsides of vector data include:
Potential loss of detail compared to raster
Potential bias in datasets - what didn’t get recorded?
Calculations involving multiple vector layers need to do math on the geometry as well as the attributes, so can be slow compared to raster math.
13.4. Tools to Inspect and Manipulate GeoJSON Data#
JSON is a lightweight, text-based, language-independent data interchange format. As a result, you can create and edit GeoJSON files in any text editor software.
You can open these files in VS Code. There are multiple extensions in VS Code (such as Geo Data Viewer) which you can use to visualize GeoJSON in VS Code. You can certainly open then in QGIS as well.
In the next lecture, you will learn how to work with geospatial vector data in Python.