17. Review of Raster Data#
In this lecture, we will review geospatial raster data structures.
Attribution The content of this lecture are modified from two excellent sources: Introduction to Raster Data in Python from Earth Lab CU Boulder; and Introduction to Raster Data from Software Carpentry.
17.1. Geospatial Raster Data#
In the lection on Vector Data you learned about different types of vector data. The other primary type of geospatial data is raster. Raster data is stored as a grid of values which are rendered on a map as pixels. Each pixel value represents an area on the Earth’s surface.
17.2. What is a Raster?#
Raster data is any pixelated (or gridded) data where each pixel is associated with a specific geographic location. The value of a pixel can be continuous (e.g. elevation) or categorical (e.g. land use). If this sounds familiar, it is because this data structure is very common: it’s how we represent any digital image. A geospatial raster is only different from a digital photo in that it is accompanied by spatial information that connects the data to a particular location. This includes the raster’s extent and cell size, the number of rows and columns, and its coordinate reference system (or CRS).
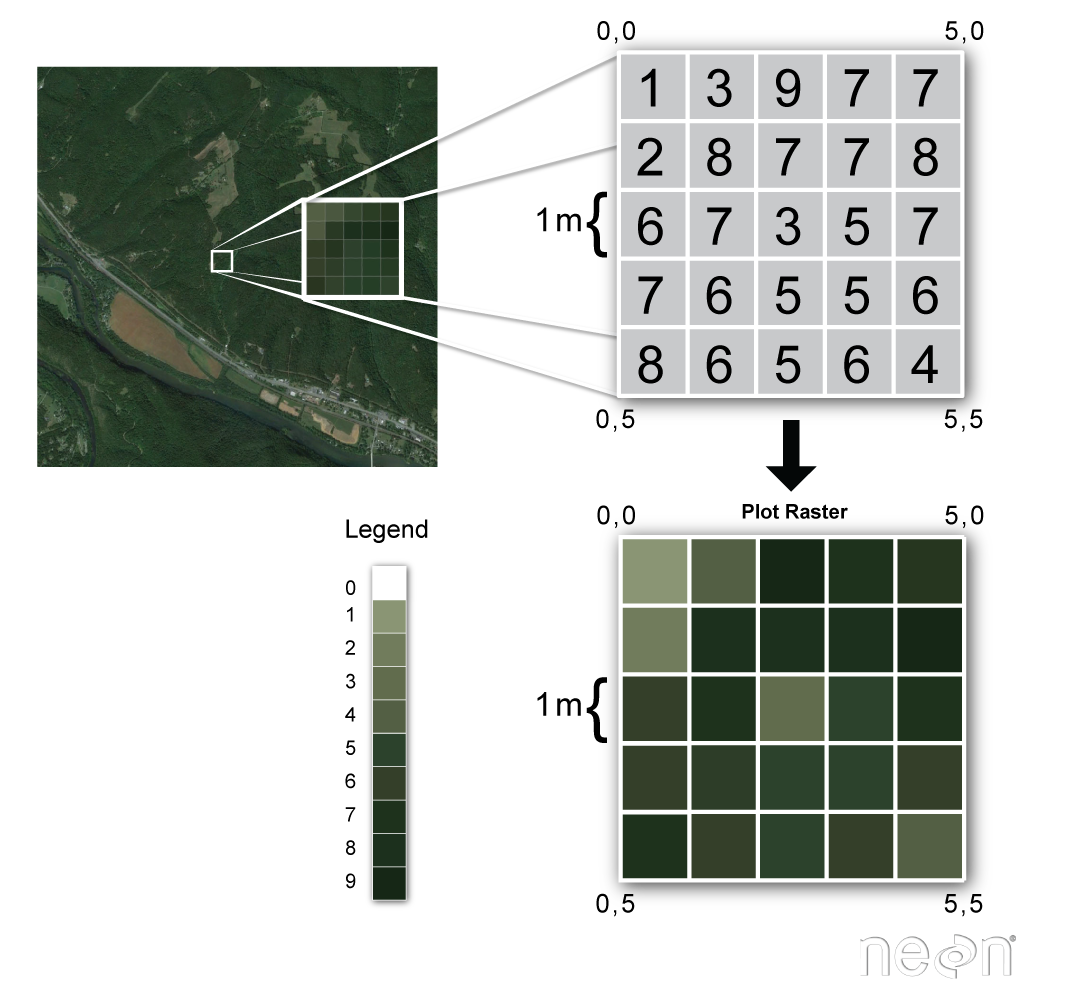
Fig. 17.1 Raster data concept (Source: National Ecological Observatory Network (NEON))#
Some examples of continuous rasters include:
Precipitation maps.
Maps of tree height derived from LiDAR data.
Elevation values for a region.
Some rasters contain categorical data where each pixel represents a discrete class such as a landcover type (e.g., “forest” or “grassland”) rather than a continuous value such as elevation or temperature. Some examples of classified maps include:
Land cover / land use maps.
Tree height maps classified as short, medium, and tall trees.
Elevation maps classified as low, medium, and high elevation.
17.3. Resolution#
A resolution of a raster represents the area on the ground that each pixel of the raster covers. So, a 1 meter resolution raster, means that each pixel represents a 1 m by 1 m area on the ground. The image below illustrates the effect of changes in resolution.
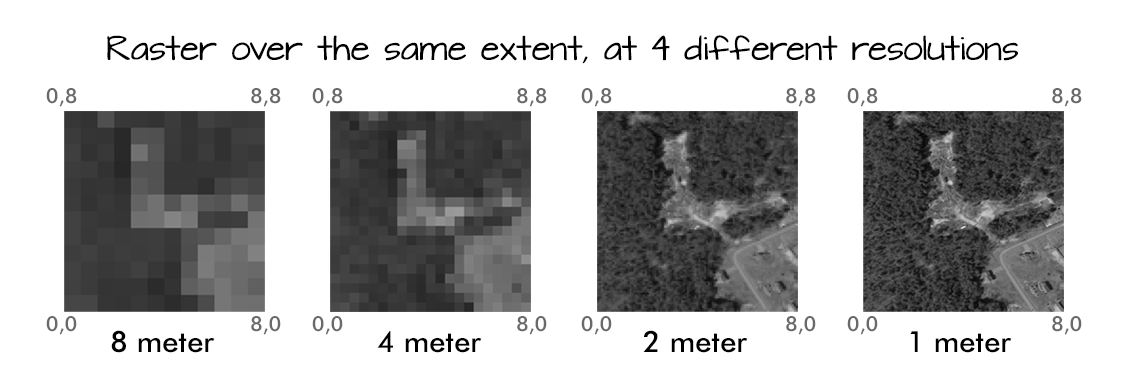
Fig. 17.2 Rasters can be stored at different resolutions. The resolution simply represents the size of each pixel cell. (Source: National Ecological Observatory Network (NEON))#
17.4. Raster Bands#
A raster can contain one or more bands. One type of multi-band raster dataset that is familiar to many of us is a color image. A basic color image consists of three bands: red, green, and blue. Each band represents light reflected from the red, green or blue portions of the electromagnetic spectrum. The pixel brightness for each band, when composited creates the colors that we see in an image.
Another type of multi-band raster data is time series in which observations of the same variable (single band) over the same area is stacked together.
We can plot each band of a multi-band image individually. Or we can composite all three bands together to make a color image. In a multi-band dataset, the rasters will always have the same extent, resolution, and CRS.
17.5. NoData Values in Rasters#
Raster data often has a NoDataValue associated with it. This is a value assigned to pixels where data are missing or no data were collected.
By default the shape of a raster is always square or rectangular. So if we have a dataset that has a shape that isn’t square or rectangular, some pixels at the edge of the raster will have NoDataValues. This often happens when the data were collected by an airplane or satellite which only flew over some part of a defined region.