17. Geospatial Vector Data in Python#
Attribution: Parts of this tutorial are developed based on the content from the following great sources: Vector data in Python; and Introduction to GeoPandas.
In this lecture, you will learn how to interact with geospatial vector data in Python. In this lecture, our focus is on smaller datasets, and in the next one we will learn how to handle large datasets for scalable analysis.
We will use the GeoPandas package to open, manipulate and write vector datasets.
You can access this notebook (in a Docker image) on this GitHub repo.
17.1. Intro to GeoPandas#
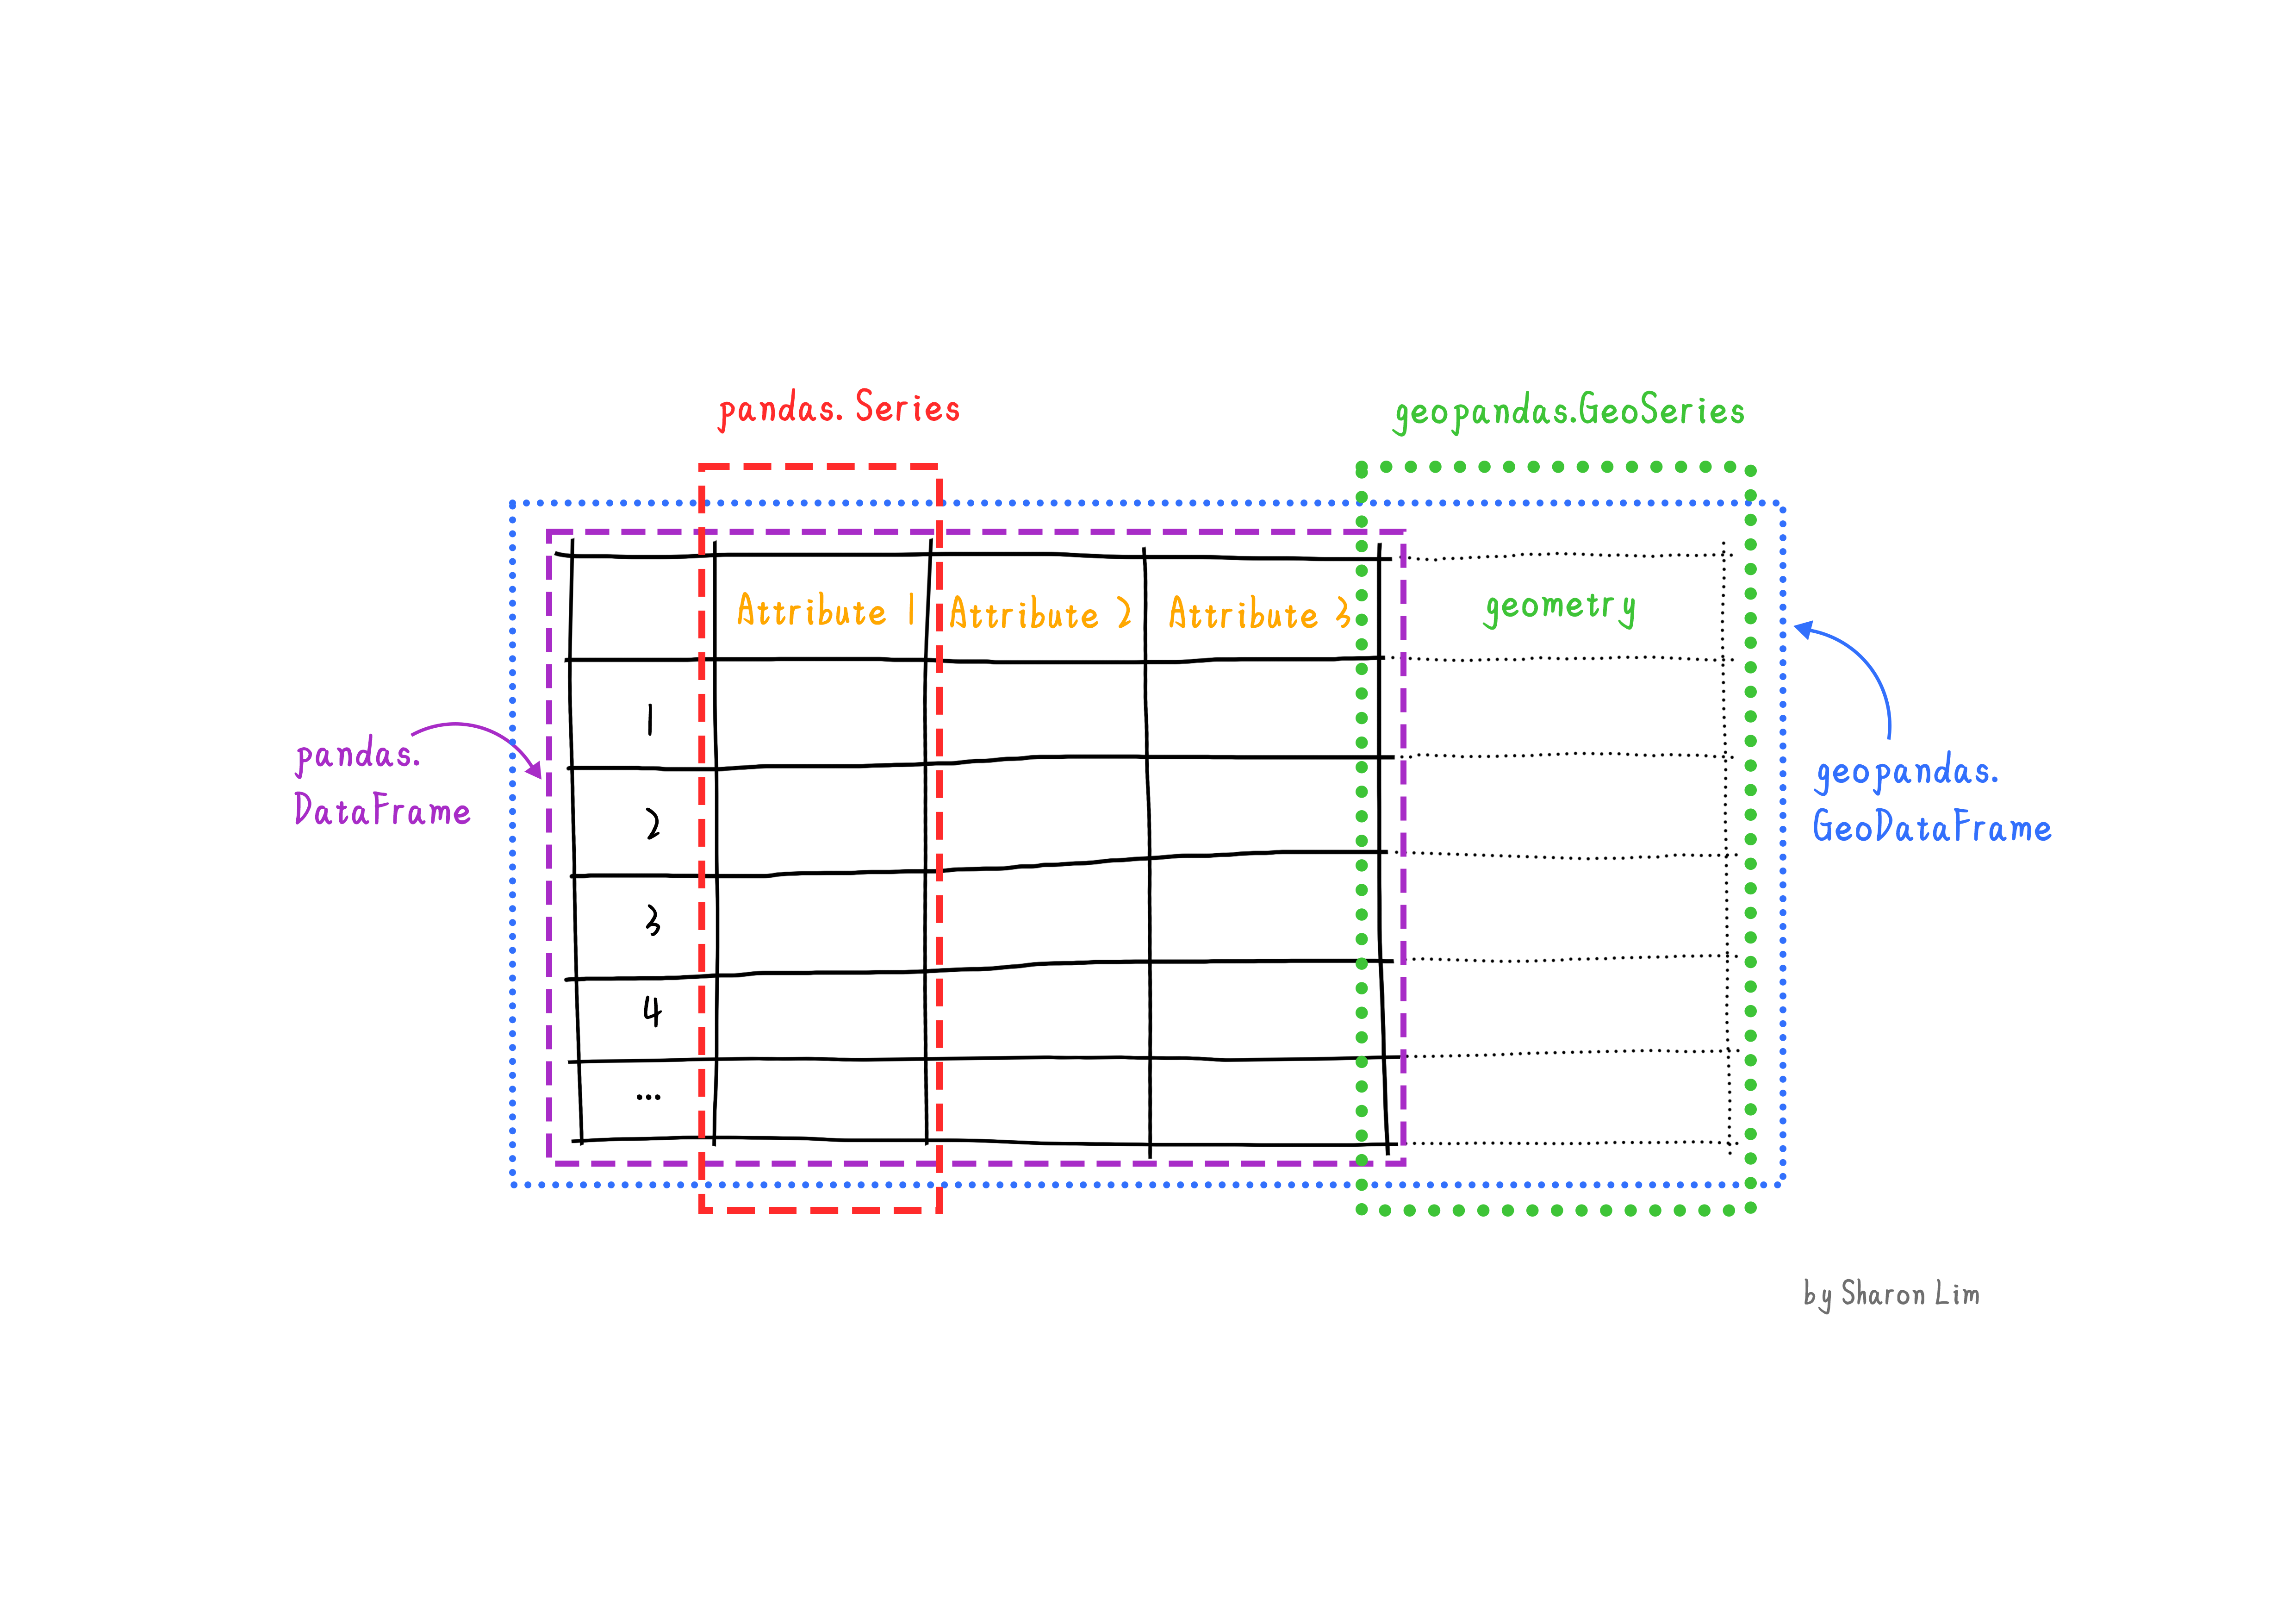
GeoPandas extends the popular pandas library for data analysis to geospatial applications. The main pandas objects (the Series and the DataFrame) are expanded to GeoPandas objects (GeoSeries and GeoDataFrame). This extension is implemented by including geometric types, represented in Python using the shapely library, and by providing dedicated methods for spatial operations (union, intersection, etc.). The relationship between Series, DataFrame, GeoSeries and GeoDataFrame can be briefly explained as follow:
A
Seriesis a one-dimensional array with axis, holding any data type (integers, strings, floating-point numbers, Python objects, etc.)A
DataFrameis a two-dimensional labeled data structure with columns of potentially different types.A
GeoSeriesis aSeriesobject designed to store shapely geometry objects.A
GeoDataFrameis an extenedpandas.DataFrame, which has a column with geometry objects, and this column is aGeoSeries.
Each GeoSeries can contain any geometry type (you can even mix them within a single DataFrame) and has a GeoSeries.crs attribute, which stores information about the projection. Therefore, each GeoSeries in a GeoDataFrame can be in a different projection, allowing you to have, for example, multiple versions (different projections) of the same geometry.
Note:
Only one GeoSeries in a GeoDataFrame is considered the active geometry, which means that all geometric operations applied to a GeoDataFrame operate on the active column.
import matplotlib.pyplot as plt
import geopandas as gpd
from cartopy import crs as ccrs
import geodatasets
import pandas as pd
17.2. Reading Files#
In this section, we use the geodatasets package to find and fetch example spatial datasets. geodatasets contains an API on top of a JSON with metadata of externally hosted datasets containing geospatial information useful for illustrative and educational purposes.
geodatasets.data
-
geodatasets.Bunch53 items
-
geodatasets.Datasetgeoda.airbnb
- url
- https://geodacenter.github.io/data-and-lab//data/airbnb.zip
- license
- NA
- attribution
- Center for Spatial Data Science, University of Chicago
- description
- Airbnb rentals, socioeconomics, and crime in Chicago
- geometry_type
- Polygon
- nrows
- 77
- ncols
- 21
- details
- https://geodacenter.github.io/data-and-lab//airbnb/
- hash
- a2ab1e3f938226d287dd76cde18c00e2d3a260640dd826da7131827d9e76c824
- filename
- airbnb.zip
-
geodatasets.Datasetgeoda.atlanta
- url
- https://geodacenter.github.io/data-and-lab//data/atlanta_hom.zip
- license
- NA
- attribution
- Center for Spatial Data Science, University of Chicago
- description
- Atlanta, GA region homicide counts and rates
- geometry_type
- Polygon
- nrows
- 90
- ncols
- 24
- details
- https://geodacenter.github.io/data-and-lab//atlanta_old/
- hash
- a33a76e12168fe84361e60c88a9df4856730487305846c559715c89b1a2b5e09
- filename
- atlanta_hom.zip
- members
- ['atlanta_hom/atl_hom.geojson']
-
geodatasets.Datasetgeoda.cars
- url
- https://geodacenter.github.io/data-and-lab//data/Abandoned_Vehicles_Map.csv
- license
- NA
- attribution
- Center for Spatial Data Science, University of Chicago
- description
- 2011 abandoned vehicles in Chicago (311 complaints).
- geometry_type
- Point
- nrows
- 137867
- ncols
- 21
- details
- https://geodacenter.github.io/data-and-lab//1-source-and-description/
- hash
- 6a0b23bc7eda2dcf1af02d43ccf506b24ca8d8c6dc2fe86a2a1cc051b03aae9e
- filename
- Abandoned_Vehicles_Map.csv
-
geodatasets.Datasetgeoda.charleston1
- url
- https://geodacenter.github.io/data-and-lab//data/CharlestonMSA.zip
- license
- NA
- attribution
- Center for Spatial Data Science, University of Chicago
- description
- 2000 Census Tract Data for Charleston, SC MSA and counties
- geometry_type
- Polygon
- nrows
- 117
- ncols
- 31
- details
- https://geodacenter.github.io/data-and-lab//charleston-1_old/
- hash
- 4a4fa9c8dd4231ae0b2f12f24895b8336bcab0c28c48653a967cffe011f63a7c
- filename
- CharlestonMSA.zip
- members
- ['CharlestonMSA/sc_final_census2.gpkg']
-
geodatasets.Datasetgeoda.charleston2
- url
- https://geodacenter.github.io/data-and-lab//data/CharlestonMSA2.zip
- license
- NA
- attribution
- Center for Spatial Data Science, University of Chicago
- description
- 1998 and 2001 Zip Code Business Patterns (Census Bureau) for Charleston, SC MSA
- geometry_type
- Polygon
- nrows
- 42
- ncols
- 60
- details
- https://geodacenter.github.io/data-and-lab//charleston2/
- hash
- 056d5d6e236b5bd95f5aee26c77bbe7d61bd07db5aaf72866c2f545205c1d8d7
- filename
- CharlestonMSA2.zip
- members
- ['CharlestonMSA2/CharlestonMSA2.gpkg']
-
geodatasets.Datasetgeoda.chicago_health
- url
- https://geodacenter.github.io/data-and-lab//data/comarea.zip
- license
- NA
- attribution
- Center for Spatial Data Science, University of Chicago
- description
- Chicago Health + Socio-Economics
- geometry_type
- Polygon
- nrows
- 77
- ncols
- 87
- details
- https://geodacenter.github.io/data-and-lab//comarea_vars/
- hash
- 4e872adb552786eae2fcd745524696e5e4cd33cc9a6c032471c0e75328871401
- filename
- comarea.zip
-
geodatasets.Datasetgeoda.chicago_commpop
- url
- https://geodacenter.github.io/data-and-lab//data/chicago_commpop.zip
- license
- NA
- attribution
- Center for Spatial Data Science, University of Chicago
- description
- Chicago Community Area Population Percent Change for 2000 and 2010
- geometry_type
- Polygon
- nrows
- 77
- ncols
- 9
- details
- https://geodacenter.github.io/data-and-lab//commpop/
- hash
- 1dbebb50c8ea47e2279ea819ef64ba793bdee2b88e4716bd6c6ec0e0d8e0e05b
- filename
- chicago_commpop.zip
- members
- ['chicago_commpop/chicago_commpop.geojson']
-
geodatasets.Datasetgeoda.chile_labor
- url
- https://geodacenter.github.io/data-and-lab//data/flma.zip
- license
- NA
- attribution
- Center for Spatial Data Science, University of Chicago
- description
- Labor Markets in Chile (1982-2002)
- geometry_type
- Polygon
- nrows
- 64
- ncols
- 140
- details
- https://geodacenter.github.io/data-and-lab//FLMA/
- hash
- 4777072268d0127b3d0be774f51d0f66c15885e9d3c92bc72c641a72f220796c
- filename
- flma.zip
- members
- ['flma/FLMA.geojson']
-
geodatasets.Datasetgeoda.cincinnati
- url
- https://geodacenter.github.io/data-and-lab//data/walnuthills_updated.zip
- license
- NA
- attribution
- Center for Spatial Data Science, University of Chicago
- description
- 2008 Cincinnati Crime + Socio-Demographics
- geometry_type
- Polygon
- nrows
- 457
- ncols
- 73
- details
- https://geodacenter.github.io/data-and-lab//walnut_hills/
- hash
- d6871dd688bd14cf4710a218d721d34f6574456f2a14d5c5cfe5a92054ee9763
- filename
- walnuthills_updated.zip
- members
- ['walnuthills_updated']
-
geodatasets.Datasetgeoda.cleveland
- url
- https://geodacenter.github.io/data-and-lab//data/cleveland.zip
- license
- NA
- attribution
- Center for Spatial Data Science, University of Chicago
- description
- 2015 sales prices of homes in Cleveland, OH.
- geometry_type
- Point
- nrows
- 205
- ncols
- 10
- details
- https://geodacenter.github.io/data-and-lab//clev_sls_154_core/
- hash
- 49aeba03eb06bf9b0d9cddd6507eb4a226b7c7a7561145562885c5cddfaeaadf
- filename
- cleveland.zip
-
geodatasets.Datasetgeoda.grid100
- url
- https://geodacenter.github.io/data-and-lab//data/grid100.zip
- license
- NA
- attribution
- Center for Spatial Data Science, University of Chicago
- description
- Grid with simulated variables
- geometry_type
- Polygon
- nrows
- 100
- ncols
- 37
- details
- https://geodacenter.github.io/data-and-lab//grid100/
- hash
- 5702ba39606044f71d53ae6a83758b81332bd3aa216b7b7b6e1c60dd0e72f476
- filename
- grid100.zip
- members
- ['grid100/grid100s.gpkg']
-
geodatasets.Datasetgeoda.groceries
- url
- https://geodacenter.github.io/data-and-lab//data/grocery.zip
- license
- NA
- attribution
- Center for Spatial Data Science, University of Chicago
- description
- 2015 Chicago supermarkets
- geometry_type
- Point
- nrows
- 148
- ncols
- 8
- details
- https://geodacenter.github.io/data-and-lab//chicago_sup_vars/
- hash
- ead10e53b21efcaa29b798428b93ba2a1c0ba1b28f046265c1737712fa83f88a
- filename
- grocery.zip
- members
- ['grocery/chicago_sup.shp', 'grocery/chicago_sup.dbf', 'grocery/chicago_sup.shx', 'grocery/chicago_sup.prj']
-
geodatasets.Datasetgeoda.guerry
- url
- https://geodacenter.github.io/data-and-lab//data/guerry.zip
- license
- NA
- attribution
- Center for Spatial Data Science, University of Chicago
- description
- Mortal statistics of France (Guerry, 1833)
- geometry_type
- Polygon
- nrows
- 85
- ncols
- 24
- details
- https://geodacenter.github.io/data-and-lab//Guerry/
- hash
- 80d2b355ad3340fcffa0a28e5cec0698af01067f8059b1a60388d200a653b3e8
- filename
- guerry.zip
- members
- ['guerry/guerry.shp', 'guerry/guerry.dbf', 'guerry/guerry.shx', 'guerry/guerry.prj']
-
geodatasets.Datasetgeoda.health
- url
- https://geodacenter.github.io/data-and-lab//data/income_diversity.zip
- license
- NA
- attribution
- Center for Spatial Data Science, University of Chicago
- description
- 2000 Health, Income + Diversity
- geometry_type
- Polygon
- nrows
- 3984
- ncols
- 65
- details
- https://geodacenter.github.io/data-and-lab//co_income_diversity_variables/
- hash
- eafee1063040258bc080e7b501bdf1438d6e45ba208954d8c2e1a7562142d0a7
- filename
- income_diversity.zip
- members
- ['income_diversity/income_diversity.shp', 'income_diversity/income_diversity.dbf', 'income_diversity/income_diversity.shx', 'income_diversity/income_diversity.prj']
-
geodatasets.Datasetgeoda.health_indicators
- url
- https://geodacenter.github.io/data-and-lab//data/healthIndicators.zip
- license
- NA
- attribution
- Center for Spatial Data Science, University of Chicago
- description
- Chicago Health Indicators (2005-11)
- geometry_type
- Polygon
- nrows
- 77
- ncols
- 32
- details
- https://geodacenter.github.io/data-and-lab//healthindicators-variables/
- hash
- b43683245f8fc3b4ab69ffa75d2064920a1a91dc76b9dcc08e288765ba0c94f3
- filename
- healthIndicators.zip
-
geodatasets.Datasetgeoda.hickory1
- url
- https://geodacenter.github.io/data-and-lab//data/HickoryMSA.zip
- license
- NA
- attribution
- Center for Spatial Data Science, University of Chicago
- description
- 2000 Census Tract Data for Hickory, NC MSA and counties
- geometry_type
- Polygon
- nrows
- 68
- ncols
- 31
- details
- https://geodacenter.github.io/data-and-lab//hickory1/
- hash
- 4c0804608d303e6e44d51966bb8927b1f5f9e060a9b91055a66478b9039d2b44
- filename
- HickoryMSA.zip
- members
- ['HickoryMSA/nc_final_census2.geojson']
-
geodatasets.Datasetgeoda.hickory2
- url
- https://geodacenter.github.io/data-and-lab//data/HickoryMSA2.zip
- license
- NA
- attribution
- Center for Spatial Data Science, University of Chicago
- description
- 1998 and 2001 Zip Code Business Patterns (Census Bureau) for Hickory, NC MSA
- geometry_type
- Polygon
- nrows
- 29
- ncols
- 56
- details
- https://geodacenter.github.io/data-and-lab//hickory2/
- hash
- 5e9498e1ff036297c3eea3cc42ac31501680a43b50c71b486799ef9021679d07
- filename
- HickoryMSA2.zip
- members
- ['HickoryMSA2/HickoryMSA2.geojson']
-
geodatasets.Datasetgeoda.home_sales
- url
- https://geodacenter.github.io/data-and-lab//data/kingcounty.zip
- license
- NA
- attribution
- Center for Spatial Data Science, University of Chicago
- description
- 2014-15 Home Sales in King County, WA
- geometry_type
- Point
- nrows
- 21613
- ncols
- 22
- details
- https://geodacenter.github.io/data-and-lab//KingCounty-HouseSales2015/
- hash
- b979f0eb2cef6ebd2c761d552821353f795635eb8db53a95f2815fc46e1f644c
- filename
- kingcounty.zip
- members
- ['kingcounty/kc_house.shp', 'kingcounty/kc_house.dbf', 'kingcounty/kc_house.shx', 'kingcounty/kc_house.prj']
-
geodatasets.Datasetgeoda.houston
- url
- https://geodacenter.github.io/data-and-lab//data/houston_hom.zip
- license
- NA
- attribution
- Center for Spatial Data Science, University of Chicago
- description
- Houston, TX region homicide counts and rates
- geometry_type
- Polygon
- nrows
- 52
- ncols
- 24
- details
- https://geodacenter.github.io/data-and-lab//houston/
- hash
- d3167fd150a1369d9a32b892d3b2a8747043d3d382c3dd81e51f696b191d0d15
- filename
- houston_hom.zip
- members
- ['houston_hom/hou_hom.geojson']
-
geodatasets.Datasetgeoda.juvenile
- url
- https://geodacenter.github.io/data-and-lab//data/juvenile.zip
- license
- NA
- attribution
- Center for Spatial Data Science, University of Chicago
- description
- Cardiff juvenile delinquent residences
- geometry_type
- Point
- nrows
- 168
- ncols
- 4
- details
- https://geodacenter.github.io/data-and-lab//juvenile/
- hash
- 811cfcfa613578214d907bfbdd396c6e02261e5cda6d56b25a6f961148de961c
- filename
- juvenile.zip
- members
- ['juvenile/juvenile.shp', 'juvenile/juvenile.shx', 'juvenile/juvenile.dbf']
-
geodatasets.Datasetgeoda.lansing1
- url
- https://geodacenter.github.io/data-and-lab//data/LansingMSA.zip
- license
- NA
- attribution
- Center for Spatial Data Science, University of Chicago
- description
- 2000 Census Tract Data for Lansing, MI MSA and counties
- geometry_type
- Polygon
- nrows
- 117
- ncols
- 31
- details
- https://geodacenter.github.io/data-and-lab//lansing1/
- hash
- 724ce3d889fa50e7632d16200cf588d40168d49adaf5bca45049dc1b3758bde1
- filename
- LansingMSA.zip
- members
- ['LansingMSA/mi_final_census2.geojson']
-
geodatasets.Datasetgeoda.lansing2
- url
- https://geodacenter.github.io/data-and-lab//data/LansingMSA2.zip
- license
- NA
- attribution
- Center for Spatial Data Science, University of Chicago
- description
- 1998 and 2001 Zip Code Business Patterns (Census Bureau) for Lansing, MI MSA
- geometry_type
- Polygon
- nrows
- 46
- ncols
- 56
- details
- https://geodacenter.github.io/data-and-lab//lansing2/
- hash
- 7657c05d3bd6090c4d5914cfe5aaf01f694601c1e0c29bc3ecbe9bc523662303
- filename
- LansingMSA2.zip
- members
- ['LansingMSA2/LansingMSA2.geojson']
-
geodatasets.Datasetgeoda.lasrosas
- url
- https://geodacenter.github.io/data-and-lab//data/lasrosas.zip
- license
- NA
- attribution
- Center for Spatial Data Science, University of Chicago
- description
- Corn yield, fertilizer and field data for precision agriculture, Argentina, 1999
- geometry_type
- Polygon
- nrows
- 1738
- ncols
- 35
- details
- https://geodacenter.github.io/data-and-lab//lasrosas/
- hash
- 038d0e82203f2875b50499dbd8498ca9c762ebd8003b2f2203ebc6acada8f8fd
- filename
- lasrosas.zip
- members
- ['lasrosas/rosas1999.gpkg']
-
geodatasets.Datasetgeoda.liquor_stores
- url
- https://geodacenter.github.io/data-and-lab//data/liquor.zip
- license
- NA
- attribution
- Center for Spatial Data Science, University of Chicago
- description
- 2015 Chicago Liquor Stores
- geometry_type
- Point
- nrows
- 571
- ncols
- 3
- details
- https://geodacenter.github.io/data-and-lab//liq_chicago/
- hash
- 6a483a6a7066a000bc97bfe71596cf28834d3088fbc958455b903a0938b3b530
- filename
- liquor.zip
- members
- ['liq_Chicago.shp', 'liq_Chicago.dbf', 'liq_Chicago.shx', 'liq_Chicago.prj']
-
geodatasets.Datasetgeoda.malaria
- url
- https://geodacenter.github.io/data-and-lab//data/malariacolomb.zip
- license
- NA
- attribution
- Center for Spatial Data Science, University of Chicago
- description
- Malaria incidence and population (1973, 95, 93 censuses and projections until 2005)
- geometry_type
- Polygon
- nrows
- 1068
- ncols
- 51
- details
- https://geodacenter.github.io/data-and-lab//colomb_malaria/
- hash
- ca77477656829833a4e3e384b02439632fa28bb577610fe5aef9e0b094c41a95
- filename
- malariacolomb.zip
- members
- ['malariacolomb/colmunic.gpkg']
-
geodatasets.Datasetgeoda.milwaukee1
- url
- https://geodacenter.github.io/data-and-lab//data/MilwaukeeMSA.zip
- license
- NA
- attribution
- Center for Spatial Data Science, University of Chicago
- description
- 2000 Census Tract Data for Milwaukee, WI MSA
- geometry_type
- Polygon
- nrows
- 417
- ncols
- 35
- details
- https://geodacenter.github.io/data-and-lab//milwaukee1/
- hash
- bf3c9617c872db26ea56f20e82a449f18bb04d8fb76a653a2d3842d465bc122c
- filename
- MilwaukeeMSA.zip
- members
- ['MilwaukeeMSA/wi_final_census2_random4.gpkg']
-
geodatasets.Datasetgeoda.milwaukee2
- url
- https://geodacenter.github.io/data-and-lab//data/MilwaukeeMSA2.zip
- license
- NA
- attribution
- Center for Spatial Data Science, University of Chicago
- description
- 1998 and 2001 Zip Code Business Patterns (Census Bureau) for Milwaukee, WI MSA
- geometry_type
- Polygon
- nrows
- 83
- ncols
- 60
- details
- https://geodacenter.github.io/data-and-lab//milwaukee2/
- hash
- 7f74212d63addb9ab84fac9447ee898498c8fafc284edcffe1f1ac79c2175d60
- filename
- MilwaukeeMSA2.zip
- members
- ['MilwaukeeMSA2/MilwaukeeMSA2.gpkg']
-
geodatasets.Datasetgeoda.ncovr
- url
- https://geodacenter.github.io/data-and-lab//data/ncovr.zip
- license
- NA
- attribution
- Center for Spatial Data Science, University of Chicago
- description
- US county homicides 1960-1990
- geometry_type
- Polygon
- nrows
- 3085
- ncols
- 70
- details
- https://geodacenter.github.io/data-and-lab//ncovr/
- hash
- e8cb04e6da634c6cd21808bd8cfe4dad6e295b22e8d40cc628e666887719cfe9
- filename
- ncovr.zip
- members
- ['ncovr/NAT.gpkg']
-
geodatasets.Datasetgeoda.natregimes
- url
- https://geodacenter.github.io/data-and-lab//data/natregimes.zip
- license
- NA
- attribution
- Center for Spatial Data Science, University of Chicago
- description
- NCOVR with regimes (book/PySAL)
- geometry_type
- Polygon
- nrows
- 3085
- ncols
- 74
- details
- https://geodacenter.github.io/data-and-lab//natregimes/
- hash
- 431d0d95ffa000692da9319e6bd28701b1156f7b8e716d4bfcd1e09b6e357918
- filename
- natregimes.zip
-
geodatasets.Datasetgeoda.ndvi
- url
- https://geodacenter.github.io/data-and-lab//data/ndvi.zip
- license
- NA
- attribution
- Center for Spatial Data Science, University of Chicago
- description
- Normalized Difference Vegetation Index grid
- geometry_type
- Polygon
- nrows
- 49
- ncols
- 8
- details
- https://geodacenter.github.io/data-and-lab//ndvi/
- hash
- a89459e50a4495c24ead1d284930467ed10eb94829de16a693a9fa89dea2fe22
- filename
- ndvi.zip
- members
- ['ndvi/ndvigrid.gpkg']
-
geodatasets.Datasetgeoda.nepal
- url
- https://geodacenter.github.io/data-and-lab//data/nepal.zip
- license
- NA
- attribution
- Center for Spatial Data Science, University of Chicago
- description
- Health, poverty and education indicators for Nepal districts
- geometry_type
- Polygon
- nrows
- 75
- ncols
- 62
- details
- https://geodacenter.github.io/data-and-lab//nepal/
- hash
- d7916568fe49ff258d0f03ac115e68f64cdac572a9fd2b29de2d70554ac2b20d
- filename
- nepal.zip
-
geodatasets.Datasetgeoda.nyc
- url
- https://geodacenter.github.io/data-and-lab///data/nyc.zip
- license
- NA
- attribution
- Center for Spatial Data Science, University of Chicago
- description
- Demographic and housing data for New York City subboroughs, 2002-09
- geometry_type
- Polygon
- nrows
- 55
- ncols
- 35
- details
- https://geodacenter.github.io/data-and-lab//nyc/
- hash
- a67dff2f9e6da9e11737e6be5a16e1bc33954e2c954332d68bcbf6ff7203702b
- filename
- nyc.zip
-
geodatasets.Datasetgeoda.nyc_earnings
- url
- https://geodacenter.github.io/data-and-lab//data/lehd.zip
- license
- NA
- attribution
- Center for Spatial Data Science, University of Chicago
- description
- Block-level Earnings in NYC (2002-14)
- geometry_type
- Polygon
- nrows
- 108487
- ncols
- 71
- details
- https://geodacenter.github.io/data-and-lab//LEHD_Data/
- hash
- 771fe11e59a16d4c15c6471d9a81df5e9c9bda5ef0a207e77d8ff21b2c16891b
- filename
- lehd.zip
-
geodatasets.Datasetgeoda.nyc_education
- url
- https://geodacenter.github.io/data-and-lab//data/nyc_2000Census.zip
- license
- NA
- attribution
- Center for Spatial Data Science, University of Chicago
- description
- NYC Education (2000)
- geometry_type
- Polygon
- nrows
- 2216
- ncols
- 57
- details
- https://geodacenter.github.io/data-and-lab//NYC-Census-2000/
- hash
- ecdf342654415107911291a8076c1685bd2c8a08d8eaed3ce9c3e9401ef714f2
- filename
- nyc_2000Census.zip
-
geodatasets.Datasetgeoda.nyc_neighborhoods
- url
- https://geodacenter.github.io/data-and-lab//data/nycnhood_acs.zip
- license
- NA
- attribution
- Center for Spatial Data Science, University of Chicago
- description
- Demographics for New York City neighborhoods
- geometry_type
- Polygon
- nrows
- 195
- ncols
- 99
- details
- https://geodacenter.github.io/data-and-lab//NYC-Nhood-ACS-2008-12/
- hash
- aeb75fc5c95fae1088093827fca69928cee3ad27039441bb35c03013d2ee403f
- filename
- nycnhood_acs.zip
-
geodatasets.Datasetgeoda.orlando1
- url
- https://geodacenter.github.io/data-and-lab//data/OrlandoMSA.zip
- license
- NA
- attribution
- Center for Spatial Data Science, University of Chicago
- description
- 2000 Census Tract Data for Orlando, FL MSA and counties
- geometry_type
- Polygon
- nrows
- 328
- ncols
- 31
- details
- https://geodacenter.github.io/data-and-lab//orlando1/
- hash
- e98ea5b9ffaf3e421ed437f665c739d1e92d9908e2b121c75ac02ecf7de2e254
- filename
- OrlandoMSA.zip
- members
- ['OrlandoMSA/orlando_final_census2.gpkg']
-
geodatasets.Datasetgeoda.orlando2
- url
- https://geodacenter.github.io/data-and-lab//data/OrlandoMSA2.zip
- license
- NA
- attribution
- Center for Spatial Data Science, University of Chicago
- description
- 1998 and 2001 Zip Code Business Patterns (Census Bureau) for Orlando, FL MSA
- geometry_type
- Polygon
- nrows
- 94
- ncols
- 60
- details
- https://geodacenter.github.io/data-and-lab//orlando2/
- hash
- 4cd8c3469cb7edea5f0fb615026192e12b1d4b50c22b28345adf476bc85d0f03
- filename
- OrlandoMSA2.zip
- members
- ['OrlandoMSA2/OrlandoMSA2.gpkg']
-
geodatasets.Datasetgeoda.oz9799
- url
- https://geodacenter.github.io/data-and-lab//data/oz9799.zip
- license
- NA
- attribution
- Center for Spatial Data Science, University of Chicago
- description
- Monthly ozone data, 1997-99
- geometry_type
- Point
- nrows
- 30
- ncols
- 78
- details
- https://geodacenter.github.io/data-and-lab//oz96/
- hash
- 1ecc7c46f5f42af6057dedc1b73f56b576cb9716d2c08d23cba98f639dfddb82
- filename
- oz9799.zip
- members
- ['oz9799/oz9799.csv']
-
geodatasets.Datasetgeoda.phoenix_acs
- url
- https://geodacenter.github.io/data-and-lab//data/phx2.zip
- license
- NA
- attribution
- Center for Spatial Data Science, University of Chicago
- description
- Phoenix American Community Survey Data (2010, 5-year averages)
- geometry_type
- Polygon
- nrows
- 985
- ncols
- 18
- details
- https://geodacenter.github.io/data-and-lab//phx/
- hash
- b2f6e196bacb6f3fe1fc909af482e7e75b83d1f8363fc73038286364c13334ee
- filename
- phx2.zip
- members
- ['phx/phx.gpkg']
-
geodatasets.Datasetgeoda.police
- url
- https://geodacenter.github.io/data-and-lab//data/police.zip
- license
- NA
- attribution
- Center for Spatial Data Science, University of Chicago
- description
- Police expenditures Mississippi counties
- geometry_type
- Polygon
- nrows
- 82
- ncols
- 22
- details
- https://geodacenter.github.io/data-and-lab//police/
- hash
- 596270d62dea8207001da84883ac265591e5de053f981c7491e7b5c738e9e9ff
- filename
- police.zip
- members
- ['police/police.gpkg']
-
geodatasets.Datasetgeoda.sacramento1
- url
- https://geodacenter.github.io/data-and-lab//data/sacramento.zip
- license
- NA
- attribution
- Center for Spatial Data Science, University of Chicago
- description
- 2000 Census Tract Data for Sacramento MSA
- geometry_type
- Polygon
- nrows
- 403
- ncols
- 32
- details
- https://geodacenter.github.io/data-and-lab//sacramento1/
- hash
- 72ddeb533cf2917dc1f458add7c6042b93c79b31316ae2d22f1c855a9da275f9
- filename
- sacramento.zip
- members
- ['sacramento/sacramentot2.gpkg']
-
geodatasets.Datasetgeoda.sacramento2
- url
- https://geodacenter.github.io/data-and-lab//data/SacramentoMSA2.zip
- license
- NA
- attribution
- Center for Spatial Data Science, University of Chicago
- description
- 1998 and 2001 Zip Code Business Patterns (Census Bureau) for Sacramento MSA
- geometry_type
- Polygon
- nrows
- 125
- ncols
- 59
- details
- https://geodacenter.github.io/data-and-lab//sacramento2/
- hash
- 3f6899efd371804ea8bfaf3cdfd3ed4753ea4d009fed38a57c5bbf442ab9468b
- filename
- SacramentoMSA2.zip
- members
- ['SacramentoMSA2/SacramentoMSA2.gpkg']
-
geodatasets.Datasetgeoda.savannah1
- url
- https://geodacenter.github.io/data-and-lab//data/SavannahMSA.zip
- license
- NA
- attribution
- Center for Spatial Data Science, University of Chicago
- description
- 2000 Census Tract Data for Savannah, GA MSA and counties
- geometry_type
- Polygon
- nrows
- 77
- ncols
- 31
- details
- https://geodacenter.github.io/data-and-lab//savannah1/
- hash
- df48c228776d2122c38935b2ebbf4cbb90c0bacc68df01161e653aab960e4208
- filename
- SavannahMSA.zip
- members
- ['SavannahMSA/ga_final_census2.gpkg']
-
geodatasets.Datasetgeoda.savannah2
- url
- https://geodacenter.github.io/data-and-lab//data/SavannahMSA2.zip
- license
- NA
- attribution
- Center for Spatial Data Science, University of Chicago
- description
- 1998 and 2001 Zip Code Business Patterns (Census Bureau) for Savannah, GA MSA
- geometry_type
- Polygon
- nrows
- 24
- ncols
- 60
- details
- https://geodacenter.github.io/data-and-lab//savannah2/
- hash
- 5b22b84a8665434cb91e800a039337f028b888082b8ef7a26d77eb6cc9aea8c1
- filename
- SavannahMSA2.zip
- members
- ['SavannahMSA2/SavannahMSA2.gpkg']
-
geodatasets.Datasetgeoda.seattle1
- url
- https://geodacenter.github.io/data-and-lab//data/SeattleMSA.zip
- license
- NA
- attribution
- Center for Spatial Data Science, University of Chicago
- description
- 2000 Census Tract Data for Seattle, WA MSA and counties
- geometry_type
- Polygon
- nrows
- 664
- ncols
- 31
- details
- https://geodacenter.github.io/data-and-lab//seattle1/
- hash
- 46fb75a30f0e7963e6108bdb19af4d7db4c72c3d5a020025cafa528c96e09daa
- filename
- SeattleMSA.zip
- members
- ['SeattleMSA/wa_final_census2.gpkg']
-
geodatasets.Datasetgeoda.seattle2
- url
- https://geodacenter.github.io/data-and-lab//data/SeattleMSA2.zip
- license
- NA
- attribution
- Center for Spatial Data Science, University of Chicago
- description
- 1998 and 2001 Zip Code Business Patterns (Census Bureau) for Seattle, WA MSA
- geometry_type
- Polygon
- nrows
- 145
- ncols
- 60
- details
- https://geodacenter.github.io/data-and-lab//seattle2/
- hash
- 3dac2fa5b8c8dfa9dd5273a85de7281e06e18ab4f197925607f815f4e44e4d0c
- filename
- SeattleMSA2.zip
- members
- ['SeattleMSA2/SeattleMSA2.gpkg']
-
geodatasets.Datasetgeoda.sids
- url
- https://geodacenter.github.io/data-and-lab//data/sids.zip
- license
- NA
- attribution
- Center for Spatial Data Science, University of Chicago
- description
- North Carolina county SIDS death counts
- geometry_type
- Polygon
- nrows
- 100
- ncols
- 15
- details
- https://geodacenter.github.io/data-and-lab//sids/
- hash
- e2f7b210b9a57839423fd170e47c02cf7a2602a480a1036bb0324e1112a4eaab
- filename
- sids.zip
- members
- ['sids/sids.gpkg']
-
geodatasets.Datasetgeoda.sids2
- url
- https://geodacenter.github.io/data-and-lab//data/sids2.zip
- license
- NA
- attribution
- Center for Spatial Data Science, University of Chicago
- description
- North Carolina county SIDS death counts and rates
- geometry_type
- Polygon
- nrows
- 100
- ncols
- 19
- details
- https://geodacenter.github.io/data-and-lab//sids2/
- hash
- b5875ffbdb261e6fa75dc4580d67111ef1434203f2d6a5d63ffac16db3a14bd0
- filename
- sids2.zip
- members
- ['sids2/sids2.gpkg']
-
geodatasets.Datasetgeoda.south
- url
- https://geodacenter.github.io/data-and-lab//data/south.zip
- license
- NA
- attribution
- Center for Spatial Data Science, University of Chicago
- description
- US Southern county homicides 1960-1990
- geometry_type
- Polygon
- nrows
- 1412
- ncols
- 70
- details
- https://geodacenter.github.io/data-and-lab//south/
- hash
- 8f151d99c643b187aad37cfb5c3212353e1bc82804a4399a63de369490e56a7a
- filename
- south.zip
- members
- ['south/south.gpkg']
-
geodatasets.Datasetgeoda.spirals
- url
- https://geodacenter.github.io/data-and-lab//data/spirals.csv
- license
- NA
- attribution
- Center for Spatial Data Science, University of Chicago
- description
- Synthetic spiral points
- geometry_type
- Point
- nrows
- 300
- ncols
- 2
- details
- https://geodacenter.github.io/data-and-lab//spirals/
- hash
- 3203b0a6db37c1207b0f1727c980814f541ce0a222597475f9c91540b1d372f1
- filename
- spirals.csv
-
geodatasets.Datasetgeoda.stlouis
- url
- https://geodacenter.github.io/data-and-lab//data/stlouis.zip
- license
- NA
- attribution
- Center for Spatial Data Science, University of Chicago
- description
- St Louis region county homicide counts and rates
- geometry_type
- Polygon
- nrows
- 78
- ncols
- 24
- details
- https://geodacenter.github.io/data-and-lab//stlouis/
- hash
- 181a17a12e9a2b2bfc9013f399e149da935e0d5cb95c3595128f67898c4365f3
- filename
- stlouis.zip
-
geodatasets.Datasetgeoda.tampa1
- url
- https://geodacenter.github.io/data-and-lab//data/TampaMSA.zip
- license
- NA
- attribution
- Center for Spatial Data Science, University of Chicago
- description
- 2000 Census Tract Data for Tampa, FL MSA and counties
- geometry_type
- Polygon
- nrows
- 547
- ncols
- 31
- details
- https://geodacenter.github.io/data-and-lab//tampa1/
- hash
- 9a7ea0746138f62aa589e8377edafea48a7b1be0cdca2b38798ba21665bfb463
- filename
- TampaMSA.zip
- members
- ['TampaMSA/tampa_final_census2.gpkg']
-
geodatasets.Datasetgeoda.us_sdoh
- url
- https://geodacenter.github.io/data-and-lab//data/us-sdoh-2014.zip
- license
- NA
- attribution
- Center for Spatial Data Science, University of Chicago
- description
- 2014 US Social Determinants of Health Data
- geometry_type
- Polygon
- nrows
- 71901
- ncols
- 26
- details
- https://geodacenter.github.io/data-and-lab//us-sdoh/
- hash
- 076701725c4b67248f79c8b8a40e74f9ad9e194d3237e1858b3d20176a6562a5
- filename
- us-sdoh-2014.zip
- members
- ['us-sdoh-2014/us-sdoh-2014.shp', 'us-sdoh-2014/us-sdoh-2014.dbf', 'us-sdoh-2014/us-sdoh-2014.shx', 'us-sdoh-2014/us-sdoh-2014.prj']
-
-
geodatasets.Bunch1 items
-
geodatasets.Datasetny.bb
- url
- https://www.nyc.gov/assets/planning/download/zip/data-maps/open-data/nybb_16a.zip
- license
- NA
- attribution
- Department of City Planning (DCP)
- description
- The borough boundaries of New York City clipped to the shoreline at mean high tide for 2016.
- geometry_type
- Polygon
- details
- https://data.cityofnewyork.us/City-Government/Borough-Boundaries/tqmj-j8zm
- nrows
- 5
- ncols
- 5
- hash
- a303be17630990455eb079777a6b31980549e9096d66d41ce0110761a7e2f92a
- filename
- nybb_16a.zip
- members
- ['nybb_16a/nybb.shp', 'nybb_16a/nybb.shx', 'nybb_16a/nybb.dbf', 'nybb_16a/nybb.prj']
-
-
geodatasets.Bunch1 items
-
geodatasets.Dataseteea.large_rivers
- url
- https://www.eea.europa.eu/data-and-maps/data/wise-large-rivers-and-large-lakes/zipped-shapefile-with-wise-large-rivers-vector-line/zipped-shapefile-with-wise-large-rivers-vector-line/at_download/file
- license
- ODC-by
- attribution
- European Environmental Agency
- description
- Large rivers in Europe that have a catchment area large than 50,000 km2.
- geometry_type
- LineString
- details
- https://www.eea.europa.eu/data-and-maps/data/wise-large-rivers-and-large-lakes
- nrows
- 20
- ncols
- 3
- hash
- 97b37b781cba30c2292122ba2bdfe2e156a791cefbdfedf611c8473facc6be50
- filename
- wise_large_rivers.zip
-
-
geodatasets.Bunch2 items
-
geodatasets.Datasetabs.australia
- url
- https://www.abs.gov.au/statistics/standards/australian-statistical-geography-standard-asgs-edition-3/jul2021-jun2026/access-and-downloads/digital-boundary-files/AUS_2021_AUST_SHP_GDA2020.zip
- license
- CC BY 4.0
- attribution
- Australian Bureau of Statistics (ABS)
- description
- Australia land polygon including Norfolk Island, the Territory of Christmas Island, and the Territory of Cocos (Keeling) Islands.
- geometry_type
- Polygon
- nrows
- 2
- ncols
- 7
- details
- https://www.abs.gov.au/statistics/standards/australian-statistical-geography-standard-asgs-edition-3/jul2021-jun2026/access-and-downloads/digital-boundary-files
- hash
- 086752a6b0b3978247be201f02e02cd4e3c4f36d4f4ca74802e6831083b67129
- filename
- AUS_2021_AUST_SHP_GDA2020.zip
-
geodatasets.Datasetabs.australia_states_territories
- url
- https://www.abs.gov.au/statistics/standards/australian-statistical-geography-standard-asgs-edition-3/jul2021-jun2026/access-and-downloads/digital-boundary-files/STE_2021_AUST_SHP_GDA2020.zip
- license
- CC BY 4.0
- attribution
- Australian Bureau of Statistics (ABS)
- description
- Australian state and territory boundaries.
- geometry_type
- Polygon
- nrows
- 10
- ncols
- 9
- details
- https://www.abs.gov.au/statistics/standards/australian-statistical-geography-standard-asgs-edition-3/jul2021-jun2026/access-and-downloads/digital-boundary-files
- hash
- d9b7f735de6085b37414faf011f796dda3c7f768c55e9dce01f96e790f399a21
- filename
- STE_2021_AUST_SHP_GDA2020.zip
-
-
geodatasets.Bunch1 items
-
geodatasets.Datasetnaturalearth.land
- url
- https://naciscdn.org/naturalearth/110m/physical/ne_110m_land.zip
- license
- CC0
- attribution
- Natural Earth
- description
- Land polygons including major islands in a 1:110m resolution.
- geometry_type
- Polygon
- details
- https://www.naturalearthdata.com/downloads/110m-physical-vectors/110m-land/
- nrows
- 127
- ncols
- 4
- hash
- 1926c621afd6ac67c3f36639bb1236134a48d82226dc675d3e3df53d02d2a3de
- filename
- ne_110m_land.zip
-
nybb_gdf = gpd.read_file(geodatasets.get_path("ny.bb"))
nybb_gdf.head()
| BoroCode | BoroName | Shape_Leng | Shape_Area | geometry | |
|---|---|---|---|---|---|
| 0 | 5 | Staten Island | 330470.010332 | 1.623820e+09 | MULTIPOLYGON (((970217.022 145643.332, 970227.... |
| 1 | 4 | Queens | 896344.047763 | 3.045213e+09 | MULTIPOLYGON (((1029606.077 156073.814, 102957... |
| 2 | 3 | Brooklyn | 741080.523166 | 1.937479e+09 | MULTIPOLYGON (((1021176.479 151374.797, 102100... |
| 3 | 1 | Manhattan | 359299.096471 | 6.364715e+08 | MULTIPOLYGON (((981219.056 188655.316, 980940.... |
| 4 | 2 | Bronx | 464392.991824 | 1.186925e+09 | MULTIPOLYGON (((1012821.806 229228.265, 101278... |
You can also select to read only parts of the data using the bbox, rows or mask argument:
nybb_partial_gdf = gpd.read_file(geodatasets.get_path("ny.bb"), rows=2)
nybb_partial_gdf
| BoroCode | BoroName | Shape_Leng | Shape_Area | geometry | |
|---|---|---|---|---|---|
| 0 | 5 | Staten Island | 330470.010332 | 1.623820e+09 | MULTIPOLYGON (((970217.022 145643.332, 970227.... |
| 1 | 4 | Queens | 896344.047763 | 3.045213e+09 | MULTIPOLYGON (((1029606.077 156073.814, 102957... |
You can retrieve the crs using the following:
nybb_gdf.crs
<Projected CRS: EPSG:2263>
Name: NAD83 / New York Long Island (ftUS)
Axis Info [cartesian]:
- X[east]: Easting (US survey foot)
- Y[north]: Northing (US survey foot)
Area of Use:
- name: United States (USA) - New York - counties of Bronx; Kings; Nassau; New York; Queens; Richmond; Suffolk.
- bounds: (-74.26, 40.47, -71.8, 41.3)
Coordinate Operation:
- name: SPCS83 New York Long Island zone (US survey foot)
- method: Lambert Conic Conformal (2SP)
Datum: North American Datum 1983
- Ellipsoid: GRS 1980
- Prime Meridian: Greenwich
17.3. Writing Files#
You can write any GeoDataFrame to local disk and set the format using the driver argument.
nybb_gdf.to_file("nybb.geojson", driver="GeoJSON")
17.4. Constructing a GeoDataFrame manually#
from shapely.geometry import Point
points_gdf = gpd.GeoDataFrame({
    'geometry': [Point(1, 1), Point(2, 2)],
    'attribute1': [1, 2],
    'attribute2': [0.1, 0.2]})
points_gdf
| geometry | attribute1 | attribute2 | |
|---|---|---|---|
| 0 | POINT (1 1) | 1 | 0.1 |
| 1 | POINT (2 2) | 2 | 0.2 |
17.5. Creating a GeoDataFrame from an existing dataframe#
Let’s create a pandas DataFrame:
cities_df = pd.DataFrame(
    {'City': ['Buenos Aires', 'Brasilia', 'Santiago', 'Bogota', 'Caracas'],
     'Country': ['Argentina', 'Brazil', 'Chile', 'Colombia', 'Venezuela'],
     'Latitude': [-34.58, -15.78, -33.45, 4.60, 10.48],
     'Longitude': [-58.66, -47.91, -70.66, -74.08, -66.86]})
cities_gdf = gpd.GeoDataFrame(
    cities_df, geometry=gpd.points_from_xy(cities_df.Longitude, cities_df.Latitude))
cities_gdf
| City | Country | Latitude | Longitude | geometry | |
|---|---|---|---|---|---|
| 0 | Buenos Aires | Argentina | -34.58 | -58.66 | POINT (-58.66 -34.58) |
| 1 | Brasilia | Brazil | -15.78 | -47.91 | POINT (-47.91 -15.78) |
| 2 | Santiago | Chile | -33.45 | -70.66 | POINT (-70.66 -33.45) |
| 3 | Bogota | Colombia | 4.60 | -74.08 | POINT (-74.08 4.6) |
| 4 | Caracas | Venezuela | 10.48 | -66.86 | POINT (-66.86 10.48) |
17.6. Working with Attributes#
All the attributes that are defined in shapely for objects, are available in GeoSeries. When you retrieve these from a GeoDataFrame however, you should note that they will be calculated based on the active geometry column.
area: shape area (units of projection – see projections)
bounds: tuple of max and min coordinates on each axis for each shape
total_bounds: tuple of max and min coordinates on each axis for entire GeoSeries
boundary:a lower dimensional object representing the object’s set-theoretic boundary. (The boundary of a polygon is a line, the boundary of a line is a collection of points. The boundary of a point is an empty collection.)
geom_type: type of geometry.
is_valid: tests if coordinates make a shape that is reasonable geometric shape according to the Simple Feature Access standard.
nybb_gdf.columns
Index(['BoroCode', 'BoroName', 'Shape_Leng', 'Shape_Area', 'geometry'], dtype='object')
nybb_gdf["boundary"] = nybb_gdf.boundary
nybb_gdf["boundary"]
0    MULTILINESTRING ((970217.022 145643.332, 97022...
1    MULTILINESTRING ((1029606.077 156073.814, 1029...
2    MULTILINESTRING ((1021176.479 151374.797, 1021...
3    MULTILINESTRING ((981219.056 188655.316, 98094...
4    MULTILINESTRING ((1012821.806 229228.265, 1012...
Name: boundary, dtype: geometry
nybb_gdf["centroid"] = nybb_gdf.centroid
nybb_gdf["centroid"]
0      POINT (941639.45 150931.991)
1    POINT (1034578.078 197116.604)
2     POINT (998769.115 174169.761)
3     POINT (993336.965 222451.437)
4      POINT (1021174.79 249937.98)
Name: centroid, dtype: geometry
With columnes boundary and centroid saved to the nybb_gdf, we now have three geometry comulmns in the same GeoDataFrame:
nybb_gdf.head()
| BoroCode | BoroName | Shape_Leng | Shape_Area | geometry | boundary | centroid | |
|---|---|---|---|---|---|---|---|
| 0 | 5 | Staten Island | 330470.010332 | 1.623820e+09 | MULTIPOLYGON (((970217.022 145643.332, 970227.... | MULTILINESTRING ((970217.022 145643.332, 97022... | POINT (941639.45 150931.991) |
| 1 | 4 | Queens | 896344.047763 | 3.045213e+09 | MULTIPOLYGON (((1029606.077 156073.814, 102957... | MULTILINESTRING ((1029606.077 156073.814, 1029... | POINT (1034578.078 197116.604) |
| 2 | 3 | Brooklyn | 741080.523166 | 1.937479e+09 | MULTIPOLYGON (((1021176.479 151374.797, 102100... | MULTILINESTRING ((1021176.479 151374.797, 1021... | POINT (998769.115 174169.761) |
| 3 | 1 | Manhattan | 359299.096471 | 6.364715e+08 | MULTIPOLYGON (((981219.056 188655.316, 980940.... | MULTILINESTRING ((981219.056 188655.316, 98094... | POINT (993336.965 222451.437) |
| 4 | 2 | Bronx | 464392.991824 | 1.186925e+09 | MULTIPOLYGON (((1012821.806 229228.265, 101278... | MULTILINESTRING ((1012821.806 229228.265, 1012... | POINT (1021174.79 249937.98) |
17.7. Applying Basic Methods#
distance(): returns a Series with minimum distance from each entry to a sample point.
centroid: returns a GeoSeries of centroids
representative_point(): returns a GeoSeries of points that are guaranteed to be within each geometry. It does NOT return centroids.
to_crs(): change coordinate reference system. See projections.
plot(): plot GeoSeries. See mapping.
We can measure the distance of each centroid from the first centroid location:
first_point = nybb_gdf["centroid"].iloc[0]
nybb_gdf["distance"] = nybb_gdf["centroid"].distance(first_point)
nybb_gdf["distance"]
0         0.000000
1    103781.535276
2     61674.893421
3     88247.742789
4    126996.283623
Name: distance, dtype: float64
17.8. Plotting GeoPandas#
Similar to pandas, if you call the plot() method of GeoDataFrame it will plot the active geometry column of it.
nybb_gdf.plot()
<Axes: >
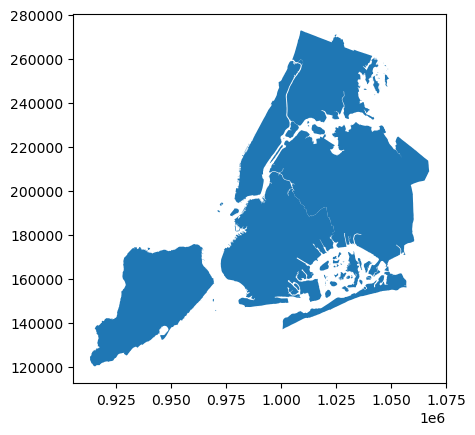
You can customize this and plot specific attributes of the GeoDataFrame. In the following, we will calculate the area of each object in the GeoDataFrame and plot it.
nybb_gdf["area"] = nybb_gdf.area
nybb_gdf.plot("area", legend=True)
<Axes: >
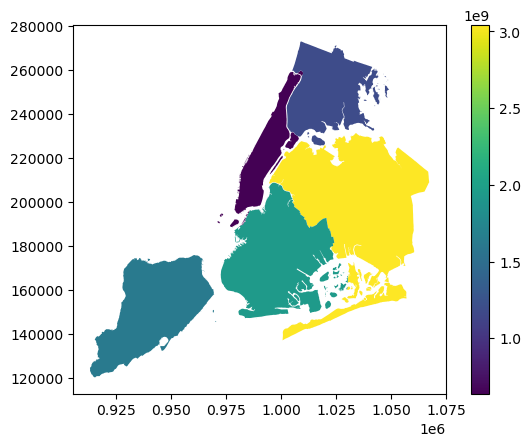
There is also an interactive way to plot the data using the explore function. This uses folium/leaflet.js to plot the data.
nybb_gdf.explore("area", legend=False)
Now, let’s set the centroid of each borough as the active geometry of the GeoDataFrame
nybb_gdf.set_geometry("centroid", inplace = True)
nybb_gdf.plot()
<Axes: >
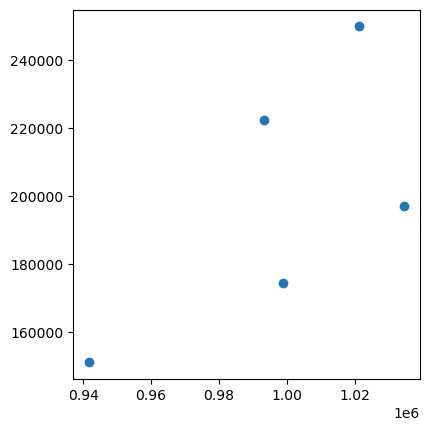
As you can see, the plot() method in this case plots the centroids which is the active geometry of the GeoDataFrame.
nybb_gdf.columns
Index(['BoroCode', 'BoroName', 'Shape_Leng', 'Shape_Area', 'geometry',
       'boundary', 'centroid', 'distance', 'area'],
      dtype='object')
nybb_gdf.geometry
0      POINT (941639.45 150931.991)
1    POINT (1034578.078 197116.604)
2     POINT (998769.115 174169.761)
3     POINT (993336.965 222451.437)
4      POINT (1021174.79 249937.98)
Name: centroid, dtype: geometry
nybb_gdf["geometry"]
0    MULTIPOLYGON (((970217.022 145643.332, 970227....
1    MULTIPOLYGON (((1029606.077 156073.814, 102957...
2    MULTIPOLYGON (((1021176.479 151374.797, 102100...
3    MULTIPOLYGON (((981219.056 188655.316, 980940....
4    MULTIPOLYGON (((1012821.806 229228.265, 101278...
Name: geometry, dtype: geometry
Note: By default when you use the read_file() command, the column containing spatial objects from the file is named “geometry”, and is set as the active geometry column. However, despite using the same term for the name of the column and the name of the special attribute that keeps track of the active column, they are distinct. You can easily shift the active geometry column to a different GeoSeries with the set_geometry() command. Further, gdf.geometry will always return the active geometry column, not the column named geometry. If you wish to call a column named “geometry”, and a different column is the active geometry column, use gdf['geometry'], not gdf.geometry.
Let’s set the geometry back to its original column
nybb_gdf.set_geometry("geometry", inplace = True)
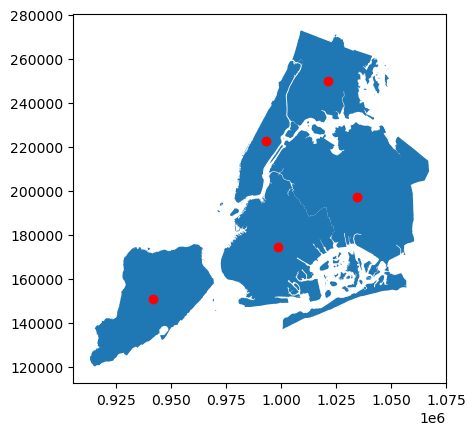
Now, let’s plot centroids on the same map as polygons:
ax = nybb_gdf.plot()
nybb_gdf["centroid"].plot(ax = ax, color = "red")
<Axes: >
17.9. Plotting with CartoPy and GeoPandas#
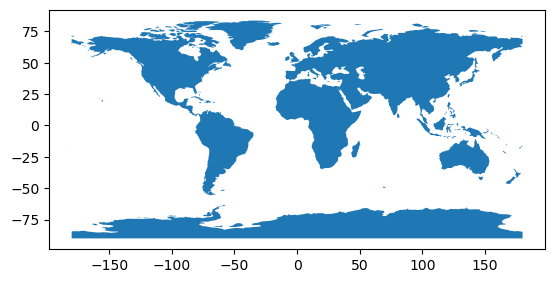
Let’s load another dataset, and plot it with both GeoPandas and CartoPy. Our goal is to use the features of CartoPy to create a better visualization of the data in a GeoDataFrame.
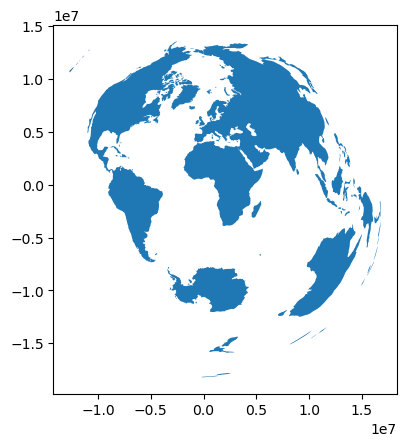
We are going to also transform the projection of a GeoDataFrame to a different crs.
land_gdf = gpd.read_file(geodatasets.get_url("naturalearth.land"))
land_gdf.plot()
<Axes: >
We can retrieve the CRS of the GeoDataFrame:
land_gdf.crs
<Geographic 2D CRS: EPSG:4326>
Name: WGS 84
Axis Info [ellipsoidal]:
- Lat[north]: Geodetic latitude (degree)
- Lon[east]: Geodetic longitude (degree)
Area of Use:
- name: World.
- bounds: (-180.0, -90.0, 180.0, 90.0)
Datum: World Geodetic System 1984 ensemble
- Ellipsoid: WGS 84
- Prime Meridian: Greenwich
We are going to a define a new CRS using CartoPy:
target_crs = ccrs.AzimuthalEquidistant()
And convert it to an EPSG CRS:
target_crs_proj4 = target_crs.to_proj4()
Now, we project the land_gdf GeoDataFrame to the new crs
land_gdf_ae = land_gdf.to_crs(target_crs_proj4)
land_gdf_ae.plot()
<Axes: >
We could have done this with CartoPy as well now that our data is in a crs understandable to CartoPy
fig, ax = plt.subplots(subplot_kw={"projection": target_crs})
ax.add_geometries(land_gdf_ae["geometry"], crs=target_crs)
<cartopy.mpl.feature_artist.FeatureArtist at 0xffff35cebd40>

17.10. Merging Data#
We can merge different GeoPandas datasets using attribute joins or spatial joins.
In attribute join, a GeoSeries or GeoDataFrame is merged with a regular pandas.Series or pandas.DataFrame based on common variables (this is similar to merging in pandas).
In a spatial join, observations from two GeoSeries or GeoDataFrame are combined based on their spatial relationships to one another.
Let’s import two example datasets to work with:
geodatasets.data
-
geodatasets.Bunch53 items
-
geodatasets.Datasetgeoda.airbnb
- url
- https://geodacenter.github.io/data-and-lab//data/airbnb.zip
- license
- NA
- attribution
- Center for Spatial Data Science, University of Chicago
- description
- Airbnb rentals, socioeconomics, and crime in Chicago
- geometry_type
- Polygon
- nrows
- 77
- ncols
- 21
- details
- https://geodacenter.github.io/data-and-lab//airbnb/
- hash
- a2ab1e3f938226d287dd76cde18c00e2d3a260640dd826da7131827d9e76c824
- filename
- airbnb.zip
-
geodatasets.Datasetgeoda.atlanta
- url
- https://geodacenter.github.io/data-and-lab//data/atlanta_hom.zip
- license
- NA
- attribution
- Center for Spatial Data Science, University of Chicago
- description
- Atlanta, GA region homicide counts and rates
- geometry_type
- Polygon
- nrows
- 90
- ncols
- 24
- details
- https://geodacenter.github.io/data-and-lab//atlanta_old/
- hash
- a33a76e12168fe84361e60c88a9df4856730487305846c559715c89b1a2b5e09
- filename
- atlanta_hom.zip
- members
- ['atlanta_hom/atl_hom.geojson']
-
geodatasets.Datasetgeoda.cars
- url
- https://geodacenter.github.io/data-and-lab//data/Abandoned_Vehicles_Map.csv
- license
- NA
- attribution
- Center for Spatial Data Science, University of Chicago
- description
- 2011 abandoned vehicles in Chicago (311 complaints).
- geometry_type
- Point
- nrows
- 137867
- ncols
- 21
- details
- https://geodacenter.github.io/data-and-lab//1-source-and-description/
- hash
- 6a0b23bc7eda2dcf1af02d43ccf506b24ca8d8c6dc2fe86a2a1cc051b03aae9e
- filename
- Abandoned_Vehicles_Map.csv
-
geodatasets.Datasetgeoda.charleston1
- url
- https://geodacenter.github.io/data-and-lab//data/CharlestonMSA.zip
- license
- NA
- attribution
- Center for Spatial Data Science, University of Chicago
- description
- 2000 Census Tract Data for Charleston, SC MSA and counties
- geometry_type
- Polygon
- nrows
- 117
- ncols
- 31
- details
- https://geodacenter.github.io/data-and-lab//charleston-1_old/
- hash
- 4a4fa9c8dd4231ae0b2f12f24895b8336bcab0c28c48653a967cffe011f63a7c
- filename
- CharlestonMSA.zip
- members
- ['CharlestonMSA/sc_final_census2.gpkg']
-
geodatasets.Datasetgeoda.charleston2
- url
- https://geodacenter.github.io/data-and-lab//data/CharlestonMSA2.zip
- license
- NA
- attribution
- Center for Spatial Data Science, University of Chicago
- description
- 1998 and 2001 Zip Code Business Patterns (Census Bureau) for Charleston, SC MSA
- geometry_type
- Polygon
- nrows
- 42
- ncols
- 60
- details
- https://geodacenter.github.io/data-and-lab//charleston2/
- hash
- 056d5d6e236b5bd95f5aee26c77bbe7d61bd07db5aaf72866c2f545205c1d8d7
- filename
- CharlestonMSA2.zip
- members
- ['CharlestonMSA2/CharlestonMSA2.gpkg']
-
geodatasets.Datasetgeoda.chicago_health
- url
- https://geodacenter.github.io/data-and-lab//data/comarea.zip
- license
- NA
- attribution
- Center for Spatial Data Science, University of Chicago
- description
- Chicago Health + Socio-Economics
- geometry_type
- Polygon
- nrows
- 77
- ncols
- 87
- details
- https://geodacenter.github.io/data-and-lab//comarea_vars/
- hash
- 4e872adb552786eae2fcd745524696e5e4cd33cc9a6c032471c0e75328871401
- filename
- comarea.zip
-
geodatasets.Datasetgeoda.chicago_commpop
- url
- https://geodacenter.github.io/data-and-lab//data/chicago_commpop.zip
- license
- NA
- attribution
- Center for Spatial Data Science, University of Chicago
- description
- Chicago Community Area Population Percent Change for 2000 and 2010
- geometry_type
- Polygon
- nrows
- 77
- ncols
- 9
- details
- https://geodacenter.github.io/data-and-lab//commpop/
- hash
- 1dbebb50c8ea47e2279ea819ef64ba793bdee2b88e4716bd6c6ec0e0d8e0e05b
- filename
- chicago_commpop.zip
- members
- ['chicago_commpop/chicago_commpop.geojson']
-
geodatasets.Datasetgeoda.chile_labor
- url
- https://geodacenter.github.io/data-and-lab//data/flma.zip
- license
- NA
- attribution
- Center for Spatial Data Science, University of Chicago
- description
- Labor Markets in Chile (1982-2002)
- geometry_type
- Polygon
- nrows
- 64
- ncols
- 140
- details
- https://geodacenter.github.io/data-and-lab//FLMA/
- hash
- 4777072268d0127b3d0be774f51d0f66c15885e9d3c92bc72c641a72f220796c
- filename
- flma.zip
- members
- ['flma/FLMA.geojson']
-
geodatasets.Datasetgeoda.cincinnati
- url
- https://geodacenter.github.io/data-and-lab//data/walnuthills_updated.zip
- license
- NA
- attribution
- Center for Spatial Data Science, University of Chicago
- description
- 2008 Cincinnati Crime + Socio-Demographics
- geometry_type
- Polygon
- nrows
- 457
- ncols
- 73
- details
- https://geodacenter.github.io/data-and-lab//walnut_hills/
- hash
- d6871dd688bd14cf4710a218d721d34f6574456f2a14d5c5cfe5a92054ee9763
- filename
- walnuthills_updated.zip
- members
- ['walnuthills_updated']
-
geodatasets.Datasetgeoda.cleveland
- url
- https://geodacenter.github.io/data-and-lab//data/cleveland.zip
- license
- NA
- attribution
- Center for Spatial Data Science, University of Chicago
- description
- 2015 sales prices of homes in Cleveland, OH.
- geometry_type
- Point
- nrows
- 205
- ncols
- 10
- details
- https://geodacenter.github.io/data-and-lab//clev_sls_154_core/
- hash
- 49aeba03eb06bf9b0d9cddd6507eb4a226b7c7a7561145562885c5cddfaeaadf
- filename
- cleveland.zip
-
geodatasets.Datasetgeoda.grid100
- url
- https://geodacenter.github.io/data-and-lab//data/grid100.zip
- license
- NA
- attribution
- Center for Spatial Data Science, University of Chicago
- description
- Grid with simulated variables
- geometry_type
- Polygon
- nrows
- 100
- ncols
- 37
- details
- https://geodacenter.github.io/data-and-lab//grid100/
- hash
- 5702ba39606044f71d53ae6a83758b81332bd3aa216b7b7b6e1c60dd0e72f476
- filename
- grid100.zip
- members
- ['grid100/grid100s.gpkg']
-
geodatasets.Datasetgeoda.groceries
- url
- https://geodacenter.github.io/data-and-lab//data/grocery.zip
- license
- NA
- attribution
- Center for Spatial Data Science, University of Chicago
- description
- 2015 Chicago supermarkets
- geometry_type
- Point
- nrows
- 148
- ncols
- 8
- details
- https://geodacenter.github.io/data-and-lab//chicago_sup_vars/
- hash
- ead10e53b21efcaa29b798428b93ba2a1c0ba1b28f046265c1737712fa83f88a
- filename
- grocery.zip
- members
- ['grocery/chicago_sup.shp', 'grocery/chicago_sup.dbf', 'grocery/chicago_sup.shx', 'grocery/chicago_sup.prj']
-
geodatasets.Datasetgeoda.guerry
- url
- https://geodacenter.github.io/data-and-lab//data/guerry.zip
- license
- NA
- attribution
- Center for Spatial Data Science, University of Chicago
- description
- Mortal statistics of France (Guerry, 1833)
- geometry_type
- Polygon
- nrows
- 85
- ncols
- 24
- details
- https://geodacenter.github.io/data-and-lab//Guerry/
- hash
- 80d2b355ad3340fcffa0a28e5cec0698af01067f8059b1a60388d200a653b3e8
- filename
- guerry.zip
- members
- ['guerry/guerry.shp', 'guerry/guerry.dbf', 'guerry/guerry.shx', 'guerry/guerry.prj']
-
geodatasets.Datasetgeoda.health
- url
- https://geodacenter.github.io/data-and-lab//data/income_diversity.zip
- license
- NA
- attribution
- Center for Spatial Data Science, University of Chicago
- description
- 2000 Health, Income + Diversity
- geometry_type
- Polygon
- nrows
- 3984
- ncols
- 65
- details
- https://geodacenter.github.io/data-and-lab//co_income_diversity_variables/
- hash
- eafee1063040258bc080e7b501bdf1438d6e45ba208954d8c2e1a7562142d0a7
- filename
- income_diversity.zip
- members
- ['income_diversity/income_diversity.shp', 'income_diversity/income_diversity.dbf', 'income_diversity/income_diversity.shx', 'income_diversity/income_diversity.prj']
-
geodatasets.Datasetgeoda.health_indicators
- url
- https://geodacenter.github.io/data-and-lab//data/healthIndicators.zip
- license
- NA
- attribution
- Center for Spatial Data Science, University of Chicago
- description
- Chicago Health Indicators (2005-11)
- geometry_type
- Polygon
- nrows
- 77
- ncols
- 32
- details
- https://geodacenter.github.io/data-and-lab//healthindicators-variables/
- hash
- b43683245f8fc3b4ab69ffa75d2064920a1a91dc76b9dcc08e288765ba0c94f3
- filename
- healthIndicators.zip
-
geodatasets.Datasetgeoda.hickory1
- url
- https://geodacenter.github.io/data-and-lab//data/HickoryMSA.zip
- license
- NA
- attribution
- Center for Spatial Data Science, University of Chicago
- description
- 2000 Census Tract Data for Hickory, NC MSA and counties
- geometry_type
- Polygon
- nrows
- 68
- ncols
- 31
- details
- https://geodacenter.github.io/data-and-lab//hickory1/
- hash
- 4c0804608d303e6e44d51966bb8927b1f5f9e060a9b91055a66478b9039d2b44
- filename
- HickoryMSA.zip
- members
- ['HickoryMSA/nc_final_census2.geojson']
-
geodatasets.Datasetgeoda.hickory2
- url
- https://geodacenter.github.io/data-and-lab//data/HickoryMSA2.zip
- license
- NA
- attribution
- Center for Spatial Data Science, University of Chicago
- description
- 1998 and 2001 Zip Code Business Patterns (Census Bureau) for Hickory, NC MSA
- geometry_type
- Polygon
- nrows
- 29
- ncols
- 56
- details
- https://geodacenter.github.io/data-and-lab//hickory2/
- hash
- 5e9498e1ff036297c3eea3cc42ac31501680a43b50c71b486799ef9021679d07
- filename
- HickoryMSA2.zip
- members
- ['HickoryMSA2/HickoryMSA2.geojson']
-
geodatasets.Datasetgeoda.home_sales
- url
- https://geodacenter.github.io/data-and-lab//data/kingcounty.zip
- license
- NA
- attribution
- Center for Spatial Data Science, University of Chicago
- description
- 2014-15 Home Sales in King County, WA
- geometry_type
- Point
- nrows
- 21613
- ncols
- 22
- details
- https://geodacenter.github.io/data-and-lab//KingCounty-HouseSales2015/
- hash
- b979f0eb2cef6ebd2c761d552821353f795635eb8db53a95f2815fc46e1f644c
- filename
- kingcounty.zip
- members
- ['kingcounty/kc_house.shp', 'kingcounty/kc_house.dbf', 'kingcounty/kc_house.shx', 'kingcounty/kc_house.prj']
-
geodatasets.Datasetgeoda.houston
- url
- https://geodacenter.github.io/data-and-lab//data/houston_hom.zip
- license
- NA
- attribution
- Center for Spatial Data Science, University of Chicago
- description
- Houston, TX region homicide counts and rates
- geometry_type
- Polygon
- nrows
- 52
- ncols
- 24
- details
- https://geodacenter.github.io/data-and-lab//houston/
- hash
- d3167fd150a1369d9a32b892d3b2a8747043d3d382c3dd81e51f696b191d0d15
- filename
- houston_hom.zip
- members
- ['houston_hom/hou_hom.geojson']
-
geodatasets.Datasetgeoda.juvenile
- url
- https://geodacenter.github.io/data-and-lab//data/juvenile.zip
- license
- NA
- attribution
- Center for Spatial Data Science, University of Chicago
- description
- Cardiff juvenile delinquent residences
- geometry_type
- Point
- nrows
- 168
- ncols
- 4
- details
- https://geodacenter.github.io/data-and-lab//juvenile/
- hash
- 811cfcfa613578214d907bfbdd396c6e02261e5cda6d56b25a6f961148de961c
- filename
- juvenile.zip
- members
- ['juvenile/juvenile.shp', 'juvenile/juvenile.shx', 'juvenile/juvenile.dbf']
-
geodatasets.Datasetgeoda.lansing1
- url
- https://geodacenter.github.io/data-and-lab//data/LansingMSA.zip
- license
- NA
- attribution
- Center for Spatial Data Science, University of Chicago
- description
- 2000 Census Tract Data for Lansing, MI MSA and counties
- geometry_type
- Polygon
- nrows
- 117
- ncols
- 31
- details
- https://geodacenter.github.io/data-and-lab//lansing1/
- hash
- 724ce3d889fa50e7632d16200cf588d40168d49adaf5bca45049dc1b3758bde1
- filename
- LansingMSA.zip
- members
- ['LansingMSA/mi_final_census2.geojson']
-
geodatasets.Datasetgeoda.lansing2
- url
- https://geodacenter.github.io/data-and-lab//data/LansingMSA2.zip
- license
- NA
- attribution
- Center for Spatial Data Science, University of Chicago
- description
- 1998 and 2001 Zip Code Business Patterns (Census Bureau) for Lansing, MI MSA
- geometry_type
- Polygon
- nrows
- 46
- ncols
- 56
- details
- https://geodacenter.github.io/data-and-lab//lansing2/
- hash
- 7657c05d3bd6090c4d5914cfe5aaf01f694601c1e0c29bc3ecbe9bc523662303
- filename
- LansingMSA2.zip
- members
- ['LansingMSA2/LansingMSA2.geojson']
-
geodatasets.Datasetgeoda.lasrosas
- url
- https://geodacenter.github.io/data-and-lab//data/lasrosas.zip
- license
- NA
- attribution
- Center for Spatial Data Science, University of Chicago
- description
- Corn yield, fertilizer and field data for precision agriculture, Argentina, 1999
- geometry_type
- Polygon
- nrows
- 1738
- ncols
- 35
- details
- https://geodacenter.github.io/data-and-lab//lasrosas/
- hash
- 038d0e82203f2875b50499dbd8498ca9c762ebd8003b2f2203ebc6acada8f8fd
- filename
- lasrosas.zip
- members
- ['lasrosas/rosas1999.gpkg']
-
geodatasets.Datasetgeoda.liquor_stores
- url
- https://geodacenter.github.io/data-and-lab//data/liquor.zip
- license
- NA
- attribution
- Center for Spatial Data Science, University of Chicago
- description
- 2015 Chicago Liquor Stores
- geometry_type
- Point
- nrows
- 571
- ncols
- 3
- details
- https://geodacenter.github.io/data-and-lab//liq_chicago/
- hash
- 6a483a6a7066a000bc97bfe71596cf28834d3088fbc958455b903a0938b3b530
- filename
- liquor.zip
- members
- ['liq_Chicago.shp', 'liq_Chicago.dbf', 'liq_Chicago.shx', 'liq_Chicago.prj']
-
geodatasets.Datasetgeoda.malaria
- url
- https://geodacenter.github.io/data-and-lab//data/malariacolomb.zip
- license
- NA
- attribution
- Center for Spatial Data Science, University of Chicago
- description
- Malaria incidence and population (1973, 95, 93 censuses and projections until 2005)
- geometry_type
- Polygon
- nrows
- 1068
- ncols
- 51
- details
- https://geodacenter.github.io/data-and-lab//colomb_malaria/
- hash
- ca77477656829833a4e3e384b02439632fa28bb577610fe5aef9e0b094c41a95
- filename
- malariacolomb.zip
- members
- ['malariacolomb/colmunic.gpkg']
-
geodatasets.Datasetgeoda.milwaukee1
- url
- https://geodacenter.github.io/data-and-lab//data/MilwaukeeMSA.zip
- license
- NA
- attribution
- Center for Spatial Data Science, University of Chicago
- description
- 2000 Census Tract Data for Milwaukee, WI MSA
- geometry_type
- Polygon
- nrows
- 417
- ncols
- 35
- details
- https://geodacenter.github.io/data-and-lab//milwaukee1/
- hash
- bf3c9617c872db26ea56f20e82a449f18bb04d8fb76a653a2d3842d465bc122c
- filename
- MilwaukeeMSA.zip
- members
- ['MilwaukeeMSA/wi_final_census2_random4.gpkg']
-
geodatasets.Datasetgeoda.milwaukee2
- url
- https://geodacenter.github.io/data-and-lab//data/MilwaukeeMSA2.zip
- license
- NA
- attribution
- Center for Spatial Data Science, University of Chicago
- description
- 1998 and 2001 Zip Code Business Patterns (Census Bureau) for Milwaukee, WI MSA
- geometry_type
- Polygon
- nrows
- 83
- ncols
- 60
- details
- https://geodacenter.github.io/data-and-lab//milwaukee2/
- hash
- 7f74212d63addb9ab84fac9447ee898498c8fafc284edcffe1f1ac79c2175d60
- filename
- MilwaukeeMSA2.zip
- members
- ['MilwaukeeMSA2/MilwaukeeMSA2.gpkg']
-
geodatasets.Datasetgeoda.ncovr
- url
- https://geodacenter.github.io/data-and-lab//data/ncovr.zip
- license
- NA
- attribution
- Center for Spatial Data Science, University of Chicago
- description
- US county homicides 1960-1990
- geometry_type
- Polygon
- nrows
- 3085
- ncols
- 70
- details
- https://geodacenter.github.io/data-and-lab//ncovr/
- hash
- e8cb04e6da634c6cd21808bd8cfe4dad6e295b22e8d40cc628e666887719cfe9
- filename
- ncovr.zip
- members
- ['ncovr/NAT.gpkg']
-
geodatasets.Datasetgeoda.natregimes
- url
- https://geodacenter.github.io/data-and-lab//data/natregimes.zip
- license
- NA
- attribution
- Center for Spatial Data Science, University of Chicago
- description
- NCOVR with regimes (book/PySAL)
- geometry_type
- Polygon
- nrows
- 3085
- ncols
- 74
- details
- https://geodacenter.github.io/data-and-lab//natregimes/
- hash
- 431d0d95ffa000692da9319e6bd28701b1156f7b8e716d4bfcd1e09b6e357918
- filename
- natregimes.zip
-
geodatasets.Datasetgeoda.ndvi
- url
- https://geodacenter.github.io/data-and-lab//data/ndvi.zip
- license
- NA
- attribution
- Center for Spatial Data Science, University of Chicago
- description
- Normalized Difference Vegetation Index grid
- geometry_type
- Polygon
- nrows
- 49
- ncols
- 8
- details
- https://geodacenter.github.io/data-and-lab//ndvi/
- hash
- a89459e50a4495c24ead1d284930467ed10eb94829de16a693a9fa89dea2fe22
- filename
- ndvi.zip
- members
- ['ndvi/ndvigrid.gpkg']
-
geodatasets.Datasetgeoda.nepal
- url
- https://geodacenter.github.io/data-and-lab//data/nepal.zip
- license
- NA
- attribution
- Center for Spatial Data Science, University of Chicago
- description
- Health, poverty and education indicators for Nepal districts
- geometry_type
- Polygon
- nrows
- 75
- ncols
- 62
- details
- https://geodacenter.github.io/data-and-lab//nepal/
- hash
- d7916568fe49ff258d0f03ac115e68f64cdac572a9fd2b29de2d70554ac2b20d
- filename
- nepal.zip
-
geodatasets.Datasetgeoda.nyc
- url
- https://geodacenter.github.io/data-and-lab///data/nyc.zip
- license
- NA
- attribution
- Center for Spatial Data Science, University of Chicago
- description
- Demographic and housing data for New York City subboroughs, 2002-09
- geometry_type
- Polygon
- nrows
- 55
- ncols
- 35
- details
- https://geodacenter.github.io/data-and-lab//nyc/
- hash
- a67dff2f9e6da9e11737e6be5a16e1bc33954e2c954332d68bcbf6ff7203702b
- filename
- nyc.zip
-
geodatasets.Datasetgeoda.nyc_earnings
- url
- https://geodacenter.github.io/data-and-lab//data/lehd.zip
- license
- NA
- attribution
- Center for Spatial Data Science, University of Chicago
- description
- Block-level Earnings in NYC (2002-14)
- geometry_type
- Polygon
- nrows
- 108487
- ncols
- 71
- details
- https://geodacenter.github.io/data-and-lab//LEHD_Data/
- hash
- 771fe11e59a16d4c15c6471d9a81df5e9c9bda5ef0a207e77d8ff21b2c16891b
- filename
- lehd.zip
-
geodatasets.Datasetgeoda.nyc_education
- url
- https://geodacenter.github.io/data-and-lab//data/nyc_2000Census.zip
- license
- NA
- attribution
- Center for Spatial Data Science, University of Chicago
- description
- NYC Education (2000)
- geometry_type
- Polygon
- nrows
- 2216
- ncols
- 57
- details
- https://geodacenter.github.io/data-and-lab//NYC-Census-2000/
- hash
- ecdf342654415107911291a8076c1685bd2c8a08d8eaed3ce9c3e9401ef714f2
- filename
- nyc_2000Census.zip
-
geodatasets.Datasetgeoda.nyc_neighborhoods
- url
- https://geodacenter.github.io/data-and-lab//data/nycnhood_acs.zip
- license
- NA
- attribution
- Center for Spatial Data Science, University of Chicago
- description
- Demographics for New York City neighborhoods
- geometry_type
- Polygon
- nrows
- 195
- ncols
- 99
- details
- https://geodacenter.github.io/data-and-lab//NYC-Nhood-ACS-2008-12/
- hash
- aeb75fc5c95fae1088093827fca69928cee3ad27039441bb35c03013d2ee403f
- filename
- nycnhood_acs.zip
-
geodatasets.Datasetgeoda.orlando1
- url
- https://geodacenter.github.io/data-and-lab//data/OrlandoMSA.zip
- license
- NA
- attribution
- Center for Spatial Data Science, University of Chicago
- description
- 2000 Census Tract Data for Orlando, FL MSA and counties
- geometry_type
- Polygon
- nrows
- 328
- ncols
- 31
- details
- https://geodacenter.github.io/data-and-lab//orlando1/
- hash
- e98ea5b9ffaf3e421ed437f665c739d1e92d9908e2b121c75ac02ecf7de2e254
- filename
- OrlandoMSA.zip
- members
- ['OrlandoMSA/orlando_final_census2.gpkg']
-
geodatasets.Datasetgeoda.orlando2
- url
- https://geodacenter.github.io/data-and-lab//data/OrlandoMSA2.zip
- license
- NA
- attribution
- Center for Spatial Data Science, University of Chicago
- description
- 1998 and 2001 Zip Code Business Patterns (Census Bureau) for Orlando, FL MSA
- geometry_type
- Polygon
- nrows
- 94
- ncols
- 60
- details
- https://geodacenter.github.io/data-and-lab//orlando2/
- hash
- 4cd8c3469cb7edea5f0fb615026192e12b1d4b50c22b28345adf476bc85d0f03
- filename
- OrlandoMSA2.zip
- members
- ['OrlandoMSA2/OrlandoMSA2.gpkg']
-
geodatasets.Datasetgeoda.oz9799
- url
- https://geodacenter.github.io/data-and-lab//data/oz9799.zip
- license
- NA
- attribution
- Center for Spatial Data Science, University of Chicago
- description
- Monthly ozone data, 1997-99
- geometry_type
- Point
- nrows
- 30
- ncols
- 78
- details
- https://geodacenter.github.io/data-and-lab//oz96/
- hash
- 1ecc7c46f5f42af6057dedc1b73f56b576cb9716d2c08d23cba98f639dfddb82
- filename
- oz9799.zip
- members
- ['oz9799/oz9799.csv']
-
geodatasets.Datasetgeoda.phoenix_acs
- url
- https://geodacenter.github.io/data-and-lab//data/phx2.zip
- license
- NA
- attribution
- Center for Spatial Data Science, University of Chicago
- description
- Phoenix American Community Survey Data (2010, 5-year averages)
- geometry_type
- Polygon
- nrows
- 985
- ncols
- 18
- details
- https://geodacenter.github.io/data-and-lab//phx/
- hash
- b2f6e196bacb6f3fe1fc909af482e7e75b83d1f8363fc73038286364c13334ee
- filename
- phx2.zip
- members
- ['phx/phx.gpkg']
-
geodatasets.Datasetgeoda.police
- url
- https://geodacenter.github.io/data-and-lab//data/police.zip
- license
- NA
- attribution
- Center for Spatial Data Science, University of Chicago
- description
- Police expenditures Mississippi counties
- geometry_type
- Polygon
- nrows
- 82
- ncols
- 22
- details
- https://geodacenter.github.io/data-and-lab//police/
- hash
- 596270d62dea8207001da84883ac265591e5de053f981c7491e7b5c738e9e9ff
- filename
- police.zip
- members
- ['police/police.gpkg']
-
geodatasets.Datasetgeoda.sacramento1
- url
- https://geodacenter.github.io/data-and-lab//data/sacramento.zip
- license
- NA
- attribution
- Center for Spatial Data Science, University of Chicago
- description
- 2000 Census Tract Data for Sacramento MSA
- geometry_type
- Polygon
- nrows
- 403
- ncols
- 32
- details
- https://geodacenter.github.io/data-and-lab//sacramento1/
- hash
- 72ddeb533cf2917dc1f458add7c6042b93c79b31316ae2d22f1c855a9da275f9
- filename
- sacramento.zip
- members
- ['sacramento/sacramentot2.gpkg']
-
geodatasets.Datasetgeoda.sacramento2
- url
- https://geodacenter.github.io/data-and-lab//data/SacramentoMSA2.zip
- license
- NA
- attribution
- Center for Spatial Data Science, University of Chicago
- description
- 1998 and 2001 Zip Code Business Patterns (Census Bureau) for Sacramento MSA
- geometry_type
- Polygon
- nrows
- 125
- ncols
- 59
- details
- https://geodacenter.github.io/data-and-lab//sacramento2/
- hash
- 3f6899efd371804ea8bfaf3cdfd3ed4753ea4d009fed38a57c5bbf442ab9468b
- filename
- SacramentoMSA2.zip
- members
- ['SacramentoMSA2/SacramentoMSA2.gpkg']
-
geodatasets.Datasetgeoda.savannah1
- url
- https://geodacenter.github.io/data-and-lab//data/SavannahMSA.zip
- license
- NA
- attribution
- Center for Spatial Data Science, University of Chicago
- description
- 2000 Census Tract Data for Savannah, GA MSA and counties
- geometry_type
- Polygon
- nrows
- 77
- ncols
- 31
- details
- https://geodacenter.github.io/data-and-lab//savannah1/
- hash
- df48c228776d2122c38935b2ebbf4cbb90c0bacc68df01161e653aab960e4208
- filename
- SavannahMSA.zip
- members
- ['SavannahMSA/ga_final_census2.gpkg']
-
geodatasets.Datasetgeoda.savannah2
- url
- https://geodacenter.github.io/data-and-lab//data/SavannahMSA2.zip
- license
- NA
- attribution
- Center for Spatial Data Science, University of Chicago
- description
- 1998 and 2001 Zip Code Business Patterns (Census Bureau) for Savannah, GA MSA
- geometry_type
- Polygon
- nrows
- 24
- ncols
- 60
- details
- https://geodacenter.github.io/data-and-lab//savannah2/
- hash
- 5b22b84a8665434cb91e800a039337f028b888082b8ef7a26d77eb6cc9aea8c1
- filename
- SavannahMSA2.zip
- members
- ['SavannahMSA2/SavannahMSA2.gpkg']
-
geodatasets.Datasetgeoda.seattle1
- url
- https://geodacenter.github.io/data-and-lab//data/SeattleMSA.zip
- license
- NA
- attribution
- Center for Spatial Data Science, University of Chicago
- description
- 2000 Census Tract Data for Seattle, WA MSA and counties
- geometry_type
- Polygon
- nrows
- 664
- ncols
- 31
- details
- https://geodacenter.github.io/data-and-lab//seattle1/
- hash
- 46fb75a30f0e7963e6108bdb19af4d7db4c72c3d5a020025cafa528c96e09daa
- filename
- SeattleMSA.zip
- members
- ['SeattleMSA/wa_final_census2.gpkg']
-
geodatasets.Datasetgeoda.seattle2
- url
- https://geodacenter.github.io/data-and-lab//data/SeattleMSA2.zip
- license
- NA
- attribution
- Center for Spatial Data Science, University of Chicago
- description
- 1998 and 2001 Zip Code Business Patterns (Census Bureau) for Seattle, WA MSA
- geometry_type
- Polygon
- nrows
- 145
- ncols
- 60
- details
- https://geodacenter.github.io/data-and-lab//seattle2/
- hash
- 3dac2fa5b8c8dfa9dd5273a85de7281e06e18ab4f197925607f815f4e44e4d0c
- filename
- SeattleMSA2.zip
- members
- ['SeattleMSA2/SeattleMSA2.gpkg']
-
geodatasets.Datasetgeoda.sids
- url
- https://geodacenter.github.io/data-and-lab//data/sids.zip
- license
- NA
- attribution
- Center for Spatial Data Science, University of Chicago
- description
- North Carolina county SIDS death counts
- geometry_type
- Polygon
- nrows
- 100
- ncols
- 15
- details
- https://geodacenter.github.io/data-and-lab//sids/
- hash
- e2f7b210b9a57839423fd170e47c02cf7a2602a480a1036bb0324e1112a4eaab
- filename
- sids.zip
- members
- ['sids/sids.gpkg']
-
geodatasets.Datasetgeoda.sids2
- url
- https://geodacenter.github.io/data-and-lab//data/sids2.zip
- license
- NA
- attribution
- Center for Spatial Data Science, University of Chicago
- description
- North Carolina county SIDS death counts and rates
- geometry_type
- Polygon
- nrows
- 100
- ncols
- 19
- details
- https://geodacenter.github.io/data-and-lab//sids2/
- hash
- b5875ffbdb261e6fa75dc4580d67111ef1434203f2d6a5d63ffac16db3a14bd0
- filename
- sids2.zip
- members
- ['sids2/sids2.gpkg']
-
geodatasets.Datasetgeoda.south
- url
- https://geodacenter.github.io/data-and-lab//data/south.zip
- license
- NA
- attribution
- Center for Spatial Data Science, University of Chicago
- description
- US Southern county homicides 1960-1990
- geometry_type
- Polygon
- nrows
- 1412
- ncols
- 70
- details
- https://geodacenter.github.io/data-and-lab//south/
- hash
- 8f151d99c643b187aad37cfb5c3212353e1bc82804a4399a63de369490e56a7a
- filename
- south.zip
- members
- ['south/south.gpkg']
-
geodatasets.Datasetgeoda.spirals
- url
- https://geodacenter.github.io/data-and-lab//data/spirals.csv
- license
- NA
- attribution
- Center for Spatial Data Science, University of Chicago
- description
- Synthetic spiral points
- geometry_type
- Point
- nrows
- 300
- ncols
- 2
- details
- https://geodacenter.github.io/data-and-lab//spirals/
- hash
- 3203b0a6db37c1207b0f1727c980814f541ce0a222597475f9c91540b1d372f1
- filename
- spirals.csv
-
geodatasets.Datasetgeoda.stlouis
- url
- https://geodacenter.github.io/data-and-lab//data/stlouis.zip
- license
- NA
- attribution
- Center for Spatial Data Science, University of Chicago
- description
- St Louis region county homicide counts and rates
- geometry_type
- Polygon
- nrows
- 78
- ncols
- 24
- details
- https://geodacenter.github.io/data-and-lab//stlouis/
- hash
- 181a17a12e9a2b2bfc9013f399e149da935e0d5cb95c3595128f67898c4365f3
- filename
- stlouis.zip
-
geodatasets.Datasetgeoda.tampa1
- url
- https://geodacenter.github.io/data-and-lab//data/TampaMSA.zip
- license
- NA
- attribution
- Center for Spatial Data Science, University of Chicago
- description
- 2000 Census Tract Data for Tampa, FL MSA and counties
- geometry_type
- Polygon
- nrows
- 547
- ncols
- 31
- details
- https://geodacenter.github.io/data-and-lab//tampa1/
- hash
- 9a7ea0746138f62aa589e8377edafea48a7b1be0cdca2b38798ba21665bfb463
- filename
- TampaMSA.zip
- members
- ['TampaMSA/tampa_final_census2.gpkg']
-
geodatasets.Datasetgeoda.us_sdoh
- url
- https://geodacenter.github.io/data-and-lab//data/us-sdoh-2014.zip
- license
- NA
- attribution
- Center for Spatial Data Science, University of Chicago
- description
- 2014 US Social Determinants of Health Data
- geometry_type
- Polygon
- nrows
- 71901
- ncols
- 26
- details
- https://geodacenter.github.io/data-and-lab//us-sdoh/
- hash
- 076701725c4b67248f79c8b8a40e74f9ad9e194d3237e1858b3d20176a6562a5
- filename
- us-sdoh-2014.zip
- members
- ['us-sdoh-2014/us-sdoh-2014.shp', 'us-sdoh-2014/us-sdoh-2014.dbf', 'us-sdoh-2014/us-sdoh-2014.shx', 'us-sdoh-2014/us-sdoh-2014.prj']
-
-
geodatasets.Bunch1 items
-
geodatasets.Datasetny.bb
- url
- https://www.nyc.gov/assets/planning/download/zip/data-maps/open-data/nybb_16a.zip
- license
- NA
- attribution
- Department of City Planning (DCP)
- description
- The borough boundaries of New York City clipped to the shoreline at mean high tide for 2016.
- geometry_type
- Polygon
- details
- https://data.cityofnewyork.us/City-Government/Borough-Boundaries/tqmj-j8zm
- nrows
- 5
- ncols
- 5
- hash
- a303be17630990455eb079777a6b31980549e9096d66d41ce0110761a7e2f92a
- filename
- nybb_16a.zip
- members
- ['nybb_16a/nybb.shp', 'nybb_16a/nybb.shx', 'nybb_16a/nybb.dbf', 'nybb_16a/nybb.prj']
-
-
geodatasets.Bunch1 items
-
geodatasets.Dataseteea.large_rivers
- url
- https://www.eea.europa.eu/data-and-maps/data/wise-large-rivers-and-large-lakes/zipped-shapefile-with-wise-large-rivers-vector-line/zipped-shapefile-with-wise-large-rivers-vector-line/at_download/file
- license
- ODC-by
- attribution
- European Environmental Agency
- description
- Large rivers in Europe that have a catchment area large than 50,000 km2.
- geometry_type
- LineString
- details
- https://www.eea.europa.eu/data-and-maps/data/wise-large-rivers-and-large-lakes
- nrows
- 20
- ncols
- 3
- hash
- 97b37b781cba30c2292122ba2bdfe2e156a791cefbdfedf611c8473facc6be50
- filename
- wise_large_rivers.zip
-
-
geodatasets.Bunch2 items
-
geodatasets.Datasetabs.australia
- url
- https://www.abs.gov.au/statistics/standards/australian-statistical-geography-standard-asgs-edition-3/jul2021-jun2026/access-and-downloads/digital-boundary-files/AUS_2021_AUST_SHP_GDA2020.zip
- license
- CC BY 4.0
- attribution
- Australian Bureau of Statistics (ABS)
- description
- Australia land polygon including Norfolk Island, the Territory of Christmas Island, and the Territory of Cocos (Keeling) Islands.
- geometry_type
- Polygon
- nrows
- 2
- ncols
- 7
- details
- https://www.abs.gov.au/statistics/standards/australian-statistical-geography-standard-asgs-edition-3/jul2021-jun2026/access-and-downloads/digital-boundary-files
- hash
- 086752a6b0b3978247be201f02e02cd4e3c4f36d4f4ca74802e6831083b67129
- filename
- AUS_2021_AUST_SHP_GDA2020.zip
-
geodatasets.Datasetabs.australia_states_territories
- url
- https://www.abs.gov.au/statistics/standards/australian-statistical-geography-standard-asgs-edition-3/jul2021-jun2026/access-and-downloads/digital-boundary-files/STE_2021_AUST_SHP_GDA2020.zip
- license
- CC BY 4.0
- attribution
- Australian Bureau of Statistics (ABS)
- description
- Australian state and territory boundaries.
- geometry_type
- Polygon
- nrows
- 10
- ncols
- 9
- details
- https://www.abs.gov.au/statistics/standards/australian-statistical-geography-standard-asgs-edition-3/jul2021-jun2026/access-and-downloads/digital-boundary-files
- hash
- d9b7f735de6085b37414faf011f796dda3c7f768c55e9dce01f96e790f399a21
- filename
- STE_2021_AUST_SHP_GDA2020.zip
-
-
geodatasets.Bunch1 items
-
geodatasets.Datasetnaturalearth.land
- url
- https://naciscdn.org/naturalearth/110m/physical/ne_110m_land.zip
- license
- CC0
- attribution
- Natural Earth
- description
- Land polygons including major islands in a 1:110m resolution.
- geometry_type
- Polygon
- details
- https://www.naturalearthdata.com/downloads/110m-physical-vectors/110m-land/
- nrows
- 127
- ncols
- 4
- hash
- 1926c621afd6ac67c3f36639bb1236134a48d82226dc675d3e3df53d02d2a3de
- filename
- ne_110m_land.zip
-
chicago = gpd.read_file(geodatasets.get_path("geoda.chicago_commpop"))

groceries = gpd.read_file(geodatasets.get_path("geoda.groceries"))


chicago_shapes = chicago[['geometry', 'NID']]

chicago_names = chicago[['community', 'NID']]


chicago = chicago[['geometry', 'community']].to_crs(groceries.crs)
chicago.head()
| geometry | community | |
|---|---|---|
| 0 | MULTIPOLYGON (((1181573.25 1886828.039, 118157... | DOUGLAS |
| 1 | MULTIPOLYGON (((1186289.356 1876750.733, 11862... | OAKLAND |
| 2 | MULTIPOLYGON (((1176344.998 1871187.546, 11763... | FULLER PARK |
| 3 | MULTIPOLYGON (((1182322.043 1876674.73, 118232... | GRAND BOULEVARD |
| 4 | MULTIPOLYGON (((1186289.356 1876750.733, 11862... | KENWOOD |
groceries.head()
| OBJECTID | Ycoord | Xcoord | Status | Address | Chain | Category | geometry | |
|---|---|---|---|---|---|---|---|---|
| 0 | 16 | 41.973266 | -87.657073 | OPEN | 1051 W ARGYLE ST, CHICAGO, IL. 60640 | VIET HOA PLAZA | None | MULTIPOINT ((1168268.672 1933554.35)) |
| 1 | 18 | 41.696367 | -87.681315 | OPEN | 10800 S WESTERN AVE, CHICAGO, IL. 60643-3226 | COUNTY FAIR FOODS | None | MULTIPOINT ((1162302.618 1832900.224)) |
| 2 | 22 | 41.868634 | -87.638638 | OPEN | 1101 S CANAL ST, CHICAGO, IL. 60607-4932 | WHOLE FOODS MARKET | None | MULTIPOINT ((1173317.042 1895425.426)) |
| 3 | 23 | 41.877590 | -87.654953 | OPEN | 1101 W JACKSON BLVD, CHICAGO, IL. 60607-2905 | TARGET/SUPER | new | MULTIPOINT ((1168996.475 1898801.406)) |
| 4 | 27 | 41.737696 | -87.625795 | OPEN | 112 W 87TH ST, CHICAGO, IL. 60620-1318 | FOOD 4 LESS | None | MULTIPOINT ((1176991.989 1847262.423)) |
17.10.1. Appending#
To append GeoDataFrames use pandas concat(). Keep in mind, that concatenated geometry columns need to have the same CRS.
joined_geometries = pd.concat([chicago.geometry, groceries.geometry])

joined_geometries
0      MULTIPOLYGON (((1181573.25 1886828.039, 118157...
1      MULTIPOLYGON (((1186289.356 1876750.733, 11862...
2      MULTIPOLYGON (((1176344.998 1871187.546, 11763...
3      MULTIPOLYGON (((1182322.043 1876674.73, 118232...
4      MULTIPOLYGON (((1186289.356 1876750.733, 11862...
                             ...
143               MULTIPOINT ((1171065.063 1899839.376))
144               MULTIPOINT ((1165217.798 1914159.975))
145               MULTIPOINT ((1166186.713 1883581.309))
146               MULTIPOINT ((1175778.816 1892214.445))
147               MULTIPOINT ((1185013.734 1832012.356))
Name: geometry, Length: 225, dtype: geometry
joined_geometries.iloc[9]
douglas = chicago[chicago.community == 'DOUGLAS']

oakland = chicago[chicago.community == 'OAKLAND']

douglas_oakland = pd.concat([douglas, oakland])

douglas_oakland
| geometry | community | |
|---|---|---|
| 0 | MULTIPOLYGON (((1181573.25 1886828.039, 118157... | DOUGLAS |
| 1 | MULTIPOLYGON (((1186289.356 1876750.733, 11862... | OAKLAND |
17.10.2. Attribute Joins#
Attribute joins are accomplished using the merge() method. We will use chicago_shapes and chicago_names which both have the NID attribute:
chicago_shapes.head()
| geometry | NID | |
|---|---|---|
| 0 | MULTIPOLYGON (((-87.60914 41.84469, -87.60915 ... | 35 |
| 1 | MULTIPOLYGON (((-87.59215 41.81693, -87.59231 ... | 36 |
| 2 | MULTIPOLYGON (((-87.6288 41.80189, -87.62879 4... | 37 |
| 3 | MULTIPOLYGON (((-87.60671 41.81681, -87.6067 4... | 38 |
| 4 | MULTIPOLYGON (((-87.59215 41.81693, -87.59215 ... | 39 |
chicago_names.head()
| community | NID | |
|---|---|---|
| 0 | DOUGLAS | 35 |
| 1 | OAKLAND | 36 |
| 2 | FULLER PARK | 37 |
| 3 | GRAND BOULEVARD | 38 |
| 4 | KENWOOD | 39 |
chicago_shapes = chicago_shapes.merge(chicago_names, on='NID')

chicago_shapes.head()
| geometry | NID | community | |
|---|---|---|---|
| 0 | MULTIPOLYGON (((-87.60914 41.84469, -87.60915 ... | 35 | DOUGLAS |
| 1 | MULTIPOLYGON (((-87.59215 41.81693, -87.59231 ... | 36 | OAKLAND |
| 2 | MULTIPOLYGON (((-87.6288 41.80189, -87.62879 4... | 37 | FULLER PARK |
| 3 | MULTIPOLYGON (((-87.60671 41.81681, -87.6067 4... | 38 | GRAND BOULEVARD |
| 4 | MULTIPOLYGON (((-87.59215 41.81693, -87.59215 ... | 39 | KENWOOD |
type(chicago_shapes)
geopandas.geodataframe.GeoDataFrame
chicago_shapes.plot("NID", legend=True)
<Axes: >
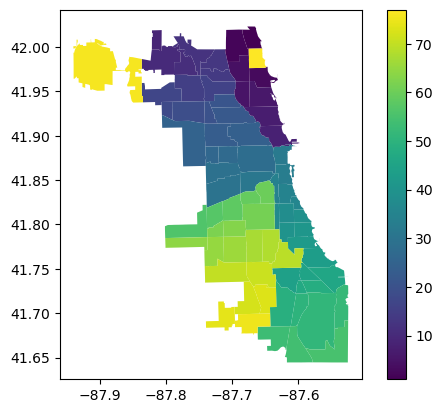
17.10.3. Spatial Joins#
In a spatial join, two geometry objects are merged based on their spatial relationship to one another.
GeoPandas provides two spatial-join functions:
GeoDataFrame.sjoin(): joins based on binary predicates (intersects, contains, etc.)GeoDataFrame.sjoin_nearest(): joins based on proximity, with the ability to set a maximum search radius.
17.10.3.1. Binary predicate joins#
Binary predicate joins are available via GeoDataFrame.sjoin() which has two core arguments: how and predicate.
predicate
The predicate argument specifies how GeoPandas decides whether or not to join the attributes of one object to another, based on their geometric relationship. The default spatial index in GeoPandas currently supports the following values for predicate which are defined in the Shapely documentation:
intersects
contains
within
touches
crosses
overlaps
The following figures from the amazing pygis.io webiste provide an intuitive illustration of different predicate methods:
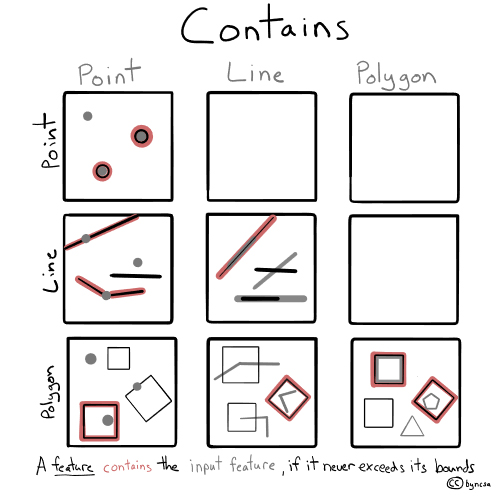
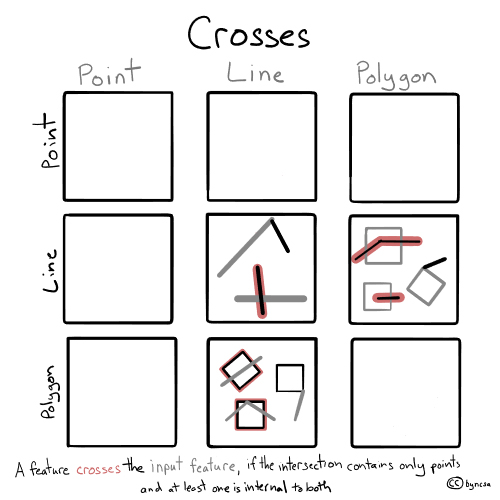
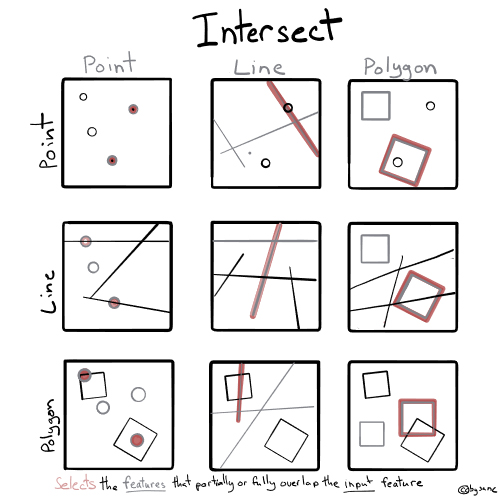

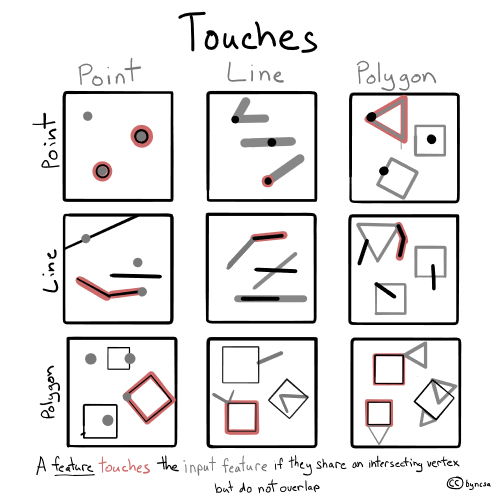
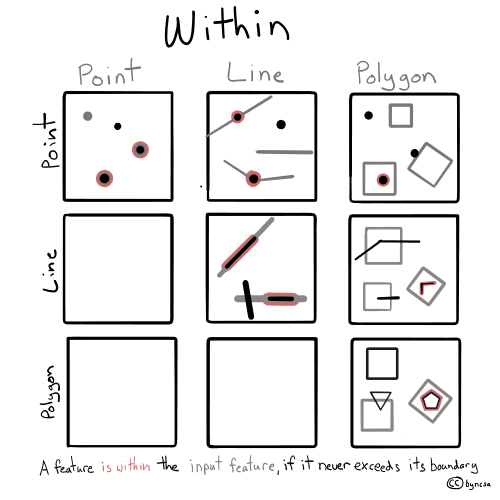
how
The how argument specifies the type of join that will occur and which geometry is retained in the resultant GeoDataFrame. It accepts the following options:
left: All features from the first or leftGeoDataFrameare kept, regardless if the features meet the specified spatial relationship criteria for a join. As all attribute fields are combined, rows that do not have a match with the right dataset may have null values in the fields that originated from the rightGeoDataFrame.right: All features from the second or rightGeoDataFrameare kept, regardless if the features meet the specified spatial relationship criteria for a join. As all attribute fields are combined, rows that do not have a match with the left dataset may have null values in the fields that originated from the leftGeoDataFrame.inner: Only features from both datasets that meet the spatial relationship for the joined are kept. The geometries from the first or leftGeoDataFrameare used for the join.
The following figure from pygis.io shows how these three join options operate (note that the “Outer” join is not implemented in GeoPandas):
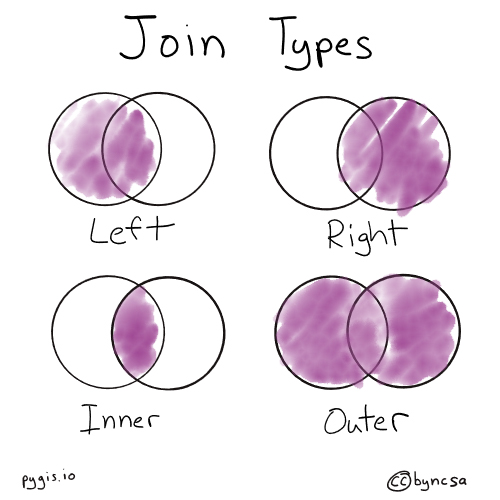
Let’s try this using the Chicago and Groceries GeoDataFrames:
chicago.head()
| geometry | community | |
|---|---|---|
| 0 | MULTIPOLYGON (((1181573.25 1886828.039, 118157... | DOUGLAS |
| 1 | MULTIPOLYGON (((1186289.356 1876750.733, 11862... | OAKLAND |
| 2 | MULTIPOLYGON (((1176344.998 1871187.546, 11763... | FULLER PARK |
| 3 | MULTIPOLYGON (((1182322.043 1876674.73, 118232... | GRAND BOULEVARD |
| 4 | MULTIPOLYGON (((1186289.356 1876750.733, 11862... | KENWOOD |
groceries.head()
| OBJECTID | Ycoord | Xcoord | Status | Address | Chain | Category | geometry | |
|---|---|---|---|---|---|---|---|---|
| 0 | 16 | 41.973266 | -87.657073 | OPEN | 1051 W ARGYLE ST, CHICAGO, IL. 60640 | VIET HOA PLAZA | None | MULTIPOINT ((1168268.672 1933554.35)) |
| 1 | 18 | 41.696367 | -87.681315 | OPEN | 10800 S WESTERN AVE, CHICAGO, IL. 60643-3226 | COUNTY FAIR FOODS | None | MULTIPOINT ((1162302.618 1832900.224)) |
| 2 | 22 | 41.868634 | -87.638638 | OPEN | 1101 S CANAL ST, CHICAGO, IL. 60607-4932 | WHOLE FOODS MARKET | None | MULTIPOINT ((1173317.042 1895425.426)) |
| 3 | 23 | 41.877590 | -87.654953 | OPEN | 1101 W JACKSON BLVD, CHICAGO, IL. 60607-2905 | TARGET/SUPER | new | MULTIPOINT ((1168996.475 1898801.406)) |
| 4 | 27 | 41.737696 | -87.625795 | OPEN | 112 W 87TH ST, CHICAGO, IL. 60620-1318 | FOOD 4 LESS | None | MULTIPOINT ((1176991.989 1847262.423)) |
Let’s first plot the data:
ax = chicago.plot()
groceries.plot(ax = ax, color="red")
<Axes: >
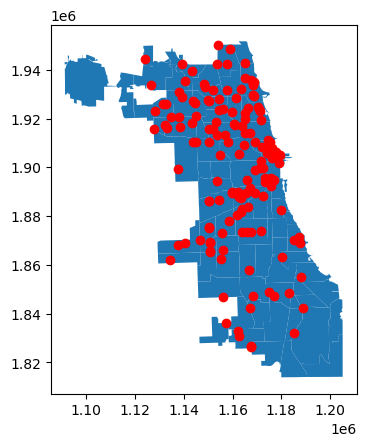
Now, we will use the groceries GeoDataFrame to find communities from the chicago GeoDataFrame that intersect with the geometries of each grocery store:
groceries_with_community = groceries.sjoin(chicago, how="inner", predicate='intersects')
groceries_with_community.head()
| OBJECTID | Ycoord | Xcoord | Status | Address | Chain | Category | geometry | index_right | community | |
|---|---|---|---|---|---|---|---|---|---|---|
| 0 | 16 | 41.973266 | -87.657073 | OPEN | 1051 W ARGYLE ST, CHICAGO, IL. 60640 | VIET HOA PLAZA | None | MULTIPOINT ((1168268.672 1933554.35)) | 30 | UPTOWN |
| 1 | 18 | 41.696367 | -87.681315 | OPEN | 10800 S WESTERN AVE, CHICAGO, IL. 60643-3226 | COUNTY FAIR FOODS | None | MULTIPOINT ((1162302.618 1832900.224)) | 73 | MORGAN PARK |
| 2 | 22 | 41.868634 | -87.638638 | OPEN | 1101 S CANAL ST, CHICAGO, IL. 60607-4932 | WHOLE FOODS MARKET | None | MULTIPOINT ((1173317.042 1895425.426)) | 28 | NEAR WEST SIDE |
| 3 | 23 | 41.877590 | -87.654953 | OPEN | 1101 W JACKSON BLVD, CHICAGO, IL. 60607-2905 | TARGET/SUPER | new | MULTIPOINT ((1168996.475 1898801.406)) | 28 | NEAR WEST SIDE |
| 4 | 27 | 41.737696 | -87.625795 | OPEN | 112 W 87TH ST, CHICAGO, IL. 60620-1318 | FOOD 4 LESS | None | MULTIPOINT ((1176991.989 1847262.423)) | 39 | CHATHAM |
Question: If we use left as the value for how in the sjoin() method, how will the result be different?
17.10.3.2. Nearest joins#
Proximity-based joins can be done via GeoDataFrame.sjoin_nearest().
GeoDataFrame.sjoin_nearest() shares the how argument with GeoDataFrame.sjoin(), and includes two additional arguments: max_distance and distance_col.
max_distance
The max_distance argument specifies a maximum search radius for matching geometries. This can have a considerable performance impact in some cases. If you can, it is highly recommended that you use this parameter.
distance_col
If set, the resultant GeoDataFrame will include a column with this name containing the computed distances between an input geometry and the nearest geometry.
